


|
By positioning itself as a solar and green energy powerhouse, Saudi Arabia can provide Europe with cost-effective, clean energy solutions, strengthening energy security while supporting the continent's efforts toward sustainable energy transitions. This strategic alignment not only fosters economic benefits for Saudi Arabia but also positions it as a key player in the global renewable energy landscape. One notable initiative is the export of 200,000 tons of green hydrogen to Europe annually by 2030, outlined in a memorandum of understanding between Saudi Arabia’s ACWA Power and Germany’s SEFE Energy Company in February 2025. When solar energy is used for electrolysis, the hydrogen produced is termed green hydrogen, as it is generated without emitting carbon dioxide. Solar power in Saudi Arabia provides a renewable and abundant source of energy crucial for exporting electricity to regional countries like Egypt and potential European countries including Italy, Germany and Greece. 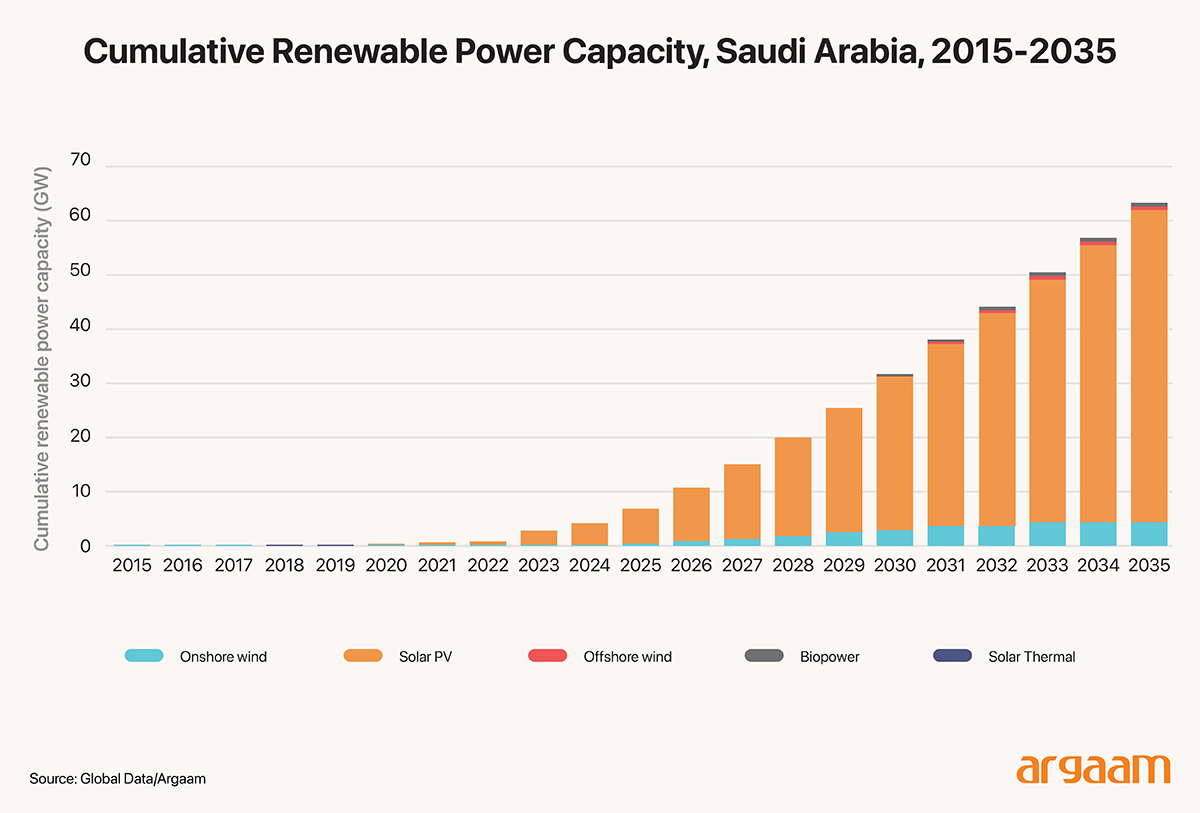 The dramatic decrease in the cost of photovoltaic PV panels over the past decade by around 80% has made solar power one of the most economical sources of electricity. 
Saudi Arabia is strategically leveraging Chinese expertise in the polysilicon sector through a significant investment by GCL Technology in a new polysilicon plant within the kingdom. Set to commence operations this year, the plant aims to achieve an impressive annual production capacity of 120,000 tons.
Polysilicon is a high-purity form of silicon used primarily in the photovoltaic solar energy industry. By collaborating with the world’s second producer of polysilicon, Saudi Arabia is not only enhancing its local production capabilities but also harnessing advanced technologies and practices developed in China’s robust solar industry. 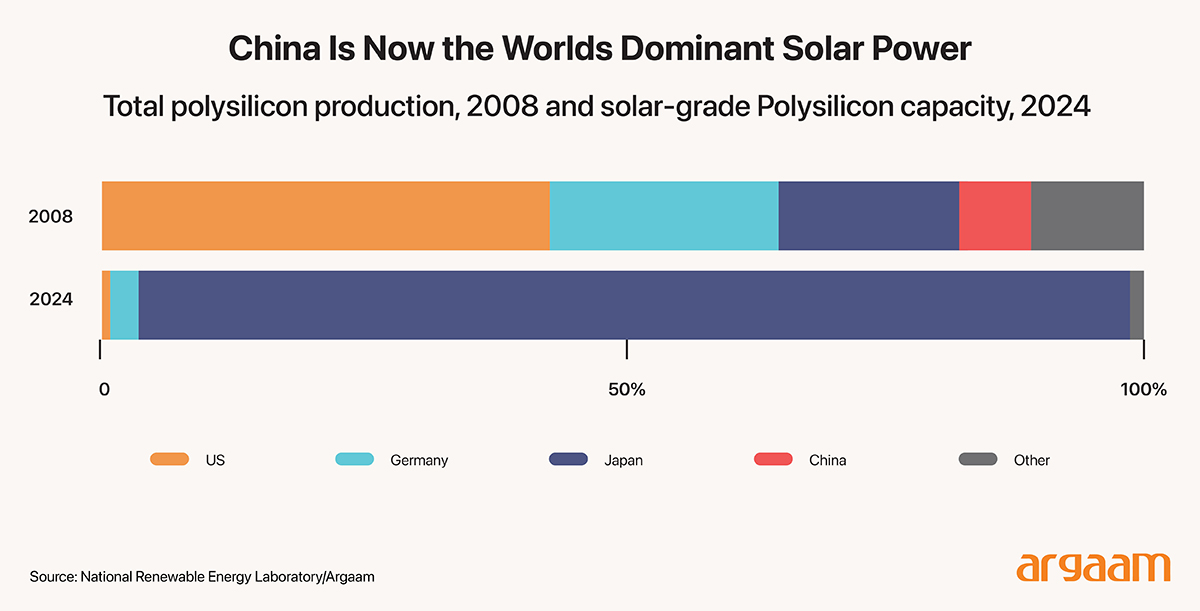
Improved production techniques thanks to the advanced R&D in China can help the Kingdom reduce costs, enabling Saudi solar energy products to be competitively priced in the European market. The ongoing Saudi development of its solar energy sector presents the Kingdom as a credible partner for sustainable energy solutions in Europe, enhancing its attractiveness as an exporter. Also demonstrating itself as a reliable energy partner, Saudi Arabia's collaboration with Egypt on the high-voltage direct current HVDC interconnection link positions it strategically in its pursuit of becoming a solar exporting powerhouse to Europe.
A high voltage direct current HVDC multi-terminal transmission grid is a type of electrical transmission system that uses direct current DC to transport electricity over long distances. Unlike traditional alternating current AC systems, HVDC technology allows for the efficient transmission of electricity with reduced losses and is particularly advantageous over long distances and undersea connections. The Saudi electricity exports to Egypt are expected to start mid 2025, which will see Saudi Arabia eventually exporting up to 3,000 MW of electricity to Egypt. This is the first ever large-scale high-voltage direct current HVDC interconnection link in the Middle East and North Africa. It will carry power along a 1,350 km route 839 mile using overhead power lines and a subsea cable across the Red Sea. This strategic subsea cable could connect Saudi Arabia to Europe later through Greece, which has a great interest in reaching energy deals with Saudi Arabia. 
The Economics of long-distance electricity transmission
HVDC is more economically viable than alternating current AC systems when transmitting electricity over long distances. HVDC requires fewer transmission lines because it can transmit higher amounts of power over existing lines. This reduces the need for expansive right-of-way and decreases land acquisition costs. The cost of HVDC cables especially for undersea or underground transmission can be lower than that of AC cables, particularly when high capacities are needed. This is because HVDC cables are typically less bulky and require less insulation. So let’s imagine a project that aims to transmit 2,000 MW of power from a solar farm located 1,000 km from a major urban center. Two options are evaluated: an HVDC line and an AC line. 
Cost Analysis
AC Transmission System:
● Line Losses: Assume that the line loss for AC transmission over 1,000 km is about 10%. Line loss refers to the energy that is dissipated as electricity travels through transmission lines, primarily due to resistance in the conductors. It results in a reduction of the total amount of electricity delivered to the end users compared to what was initially transmitted. ● Cost of AC transmission lines: Approximately $1 million per mile for overhead lines. ● Total length required for 1,000 km = 621 miles ● Cost = 621 miles x 1million/mile= $621 million ● Total Estimated Cost with Losses: ● Energy Loss at 10% for a transmission of 2,000 MW = 200 MW lost x 24 hours x 365 days = 1,752,000 MWh/year lost. ● Assuming a market price of 50/MWh, this results in a revenue loss of about $87.6 million due to energy losses. Total Cost for AC System: $621 million capital costs + $87.6 million lost revenue due to line losses = $708.6 million. 
HVDC Transmission System ● Line Losses: Assume line loss for HVDC transmission over the same distance is approximately 3%. ● Cost of HVDC transmission lines: Approximately $1.5 million per mile for HVDC overhead lines. ● Total length required for 1,000 km = 621 miles ● Cost = 621 miles x 1.5million/mile= $931.5 million ● Energy Loss at 3% for a transmission of 2,000 MW = 60 MW lost x 24 hours x 365 days = 525,600 MWh/year lost ● Assuming a market price of 50/MWh, this results in a revenue loss of about $26.28 million due to energy losses. Total Cost for HVDC System: 931.5million capitalcosts +26.28 million lost revenue due to line losses = $957.78 million. While the initial infrastructure costs for HVDC systems may appear higher, the significantly lower transmission losses provide a compelling economic argument over time. 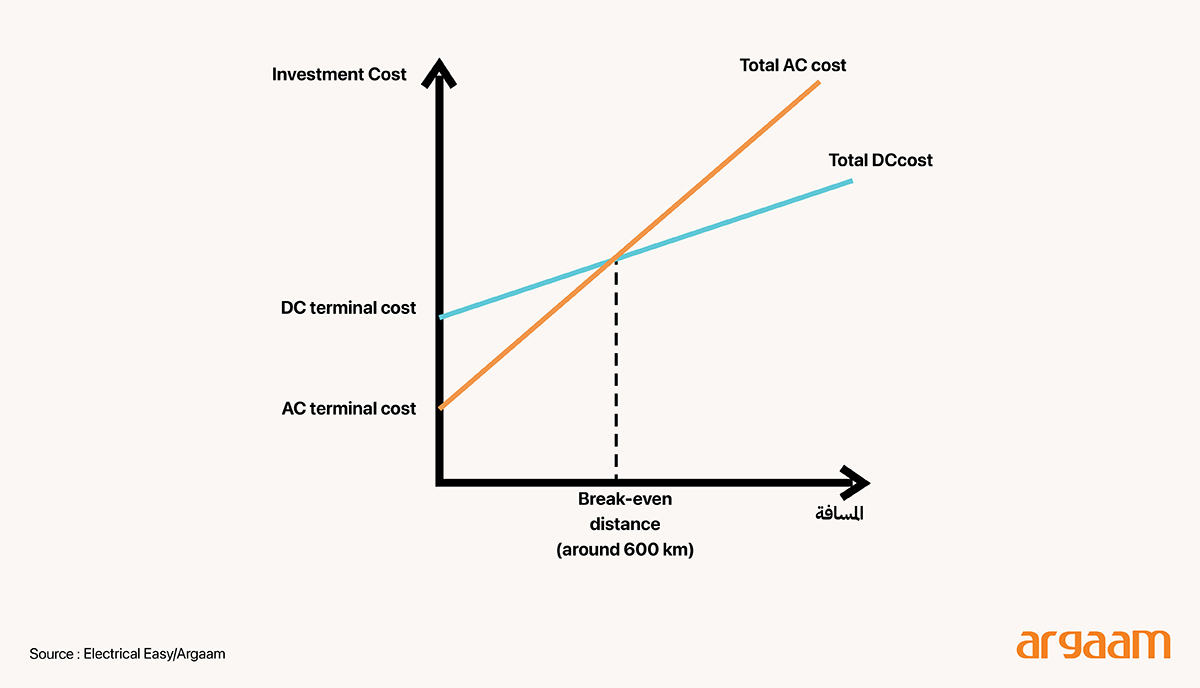
This chart shows that the DC terminal costs are typically higher due to the advanced technology required for converter stations. The breakeven distance for comparing DC and AC transmission systems typically falls around 600 to 800 kilometers approximately 370 to 500 miles. Beyond this range, DC transmission becomes more economically viable due to lower line losses. The chart further shows that it generally indicates that the total investment required for AC transmission is higher than for DC. 
High Irradiance, High Returns…why Tabuk?
In late 2023, Saudi Arabia unveiled the construction of the world’s largest single-site solar-power plant in Al Shuaibah, Mecca province. The solar-power facility is expected to start operations by end 2025, with a generation capacity of 2,060 MW. 
It’s a joint venture 50:50 between the two Saudi companies ACWA Power and Badeel. 
The two companies are backed by the Saudi Arabia’s sovereign wealth fund, the Public Investment Fund PIF, which holds a 50% and 100% stake in ACWA and Badeel respectively. Saudi Arabia enjoys an exceptional Global Horizontal Irradiance GHI levels, particularly in cities like Tabuk, located near the Red Sea. Global Horizontal Irradiance GHI: This is the total amount of solar radiation received by a horizontal surface. It is measured in kilowatt-hours per square meter per day kWh/m²/day and is a crucial factor in determining the potential solar energy output from photovoltaic PV systems. Tabuk is not only known for its vast solar farms and having the largest factory in the Middle East for producing solar panels, but also for receiving one of the highest GHI values in the region, approximately 6.4 kWh/m²/day. This high irradiance translates to superior solar energy generation potential, making it an attractive supplier for European countries transitioning to renewable energy sources. The robust GHI in Tabuk enables solar power plants to maximize energy production. A well-sited solar farm can generate significantly more energy than installations in Europe, reducing the cost per kilowatt-hour kWh for importing solar energy. Ambient temperature affects the efficiency of solar panels; cooler temperatures can enhance their performance. In Tabuk, the average ambient temperature is relatively low at about 18.9 °C. Lower temperatures help maximize the energy conversion efficiency of PV systems, leading to higher energy output. Conversely, higher temperatures can reduce efficiency due to increased resistance in photovoltaic cells.  Saudi Arabia already boasts among the world’s lowest solar-power tariffs. Let’s draw a comparison based on academic research with Europe: Suppose the average Levelized Cost of Electricity LCOE for solar PV installations in Europe is approximately $0.11 to $0.15 per kWh due to higher installation and operational costs. Levelized Cost of Electricity LCOE: is a measure used to compare the cost-effectiveness of different energy generation technologies. It represents the per-unit cost usually in USD/kWh of building and operating a generating plant over its lifetime, factoring in initial capital costs, operations and maintenance costs, and the expected output over the plant's lifespan. In contrast, due to the high Global Horizontal Irradiance GHI and favorable conditions, the projected LCOE from solar farms in Saudi Arabia could be around $0.06.
If a solar farm in Saudi Arabia has an energy output of 10 TWh/year, we can calculate the total cost of generation: ● Total Cost Calculation at an LCOE of $0.06 per kWh:
● Energy Produced = 10bn kWh ● LCOE = 0.06 USD/kWh Calculation: Total Cost=10 billion kWh × 0.06USD/kWh = $600 million.
Comparison with European Costs: If Europe relies on local solar farms with an LCOE of $0.13/kWh to meet the same demand:
● For the same 10 Tira Watt/h/year: Total Cost=10,000,000,000 kWh×0.13 USD/kWh=1,300,000,000 USD Cost Savings: When importing solar energy from Saudi Arabia: ● At 0.06/kWh, European consumers benefit from a total cost of $600 million versus $1.3 billion when generated locally. ● Potential savings for Europe: $1.3 billion − $600 million = $700 million ● Or, roughly a 54% reduction in costs. |
|
|

|
|

|

|

|
Argaam.com Copyright © 2025, Argaam Investment, All Rights Reserved |