Since its listing on the Saudi Tadawul in 2021, ACWA Power has reported a steady expansion in earnings that, on the surface, presents a compelling growth narrative. Yet a rigorous reading of those figures warrants closer examination before drawing firm conclusions about the underlying health of the business.
The central question is whether ACWA Power's improving profitability reflects genuine operational progress — more electricity sold, stronger project margins, and healthier cash generation from its core activities — or whether a meaningful portion of those gains is attributable to financial structuring: the recycling of assets, the disposal of stakes in portfolio companies, and accounting treatments that can present a more favourable picture of performance than the operating business alone would produce.
Four years of audited financial statements published since ACWA Power's IPO provide sufficient material for our analysis.
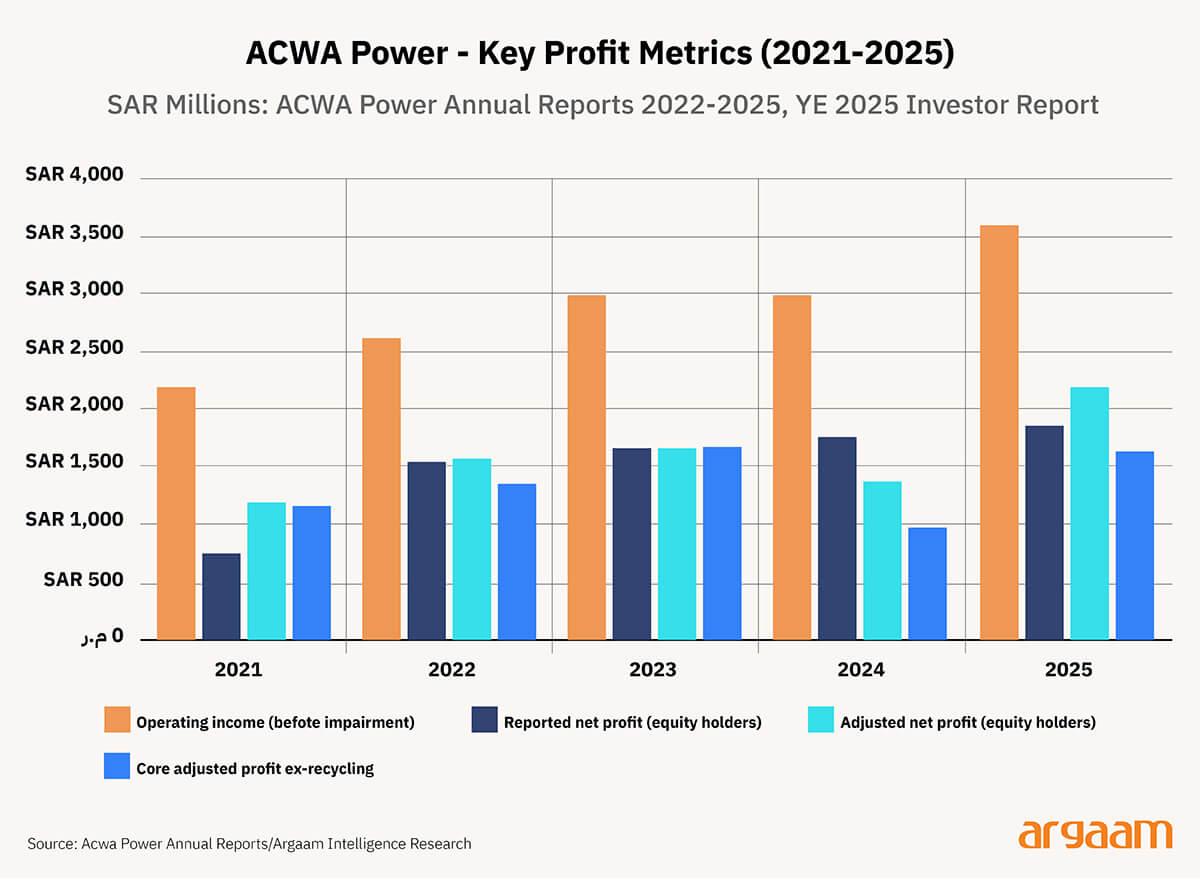
Operating income is the largest bar every year and keeps growing steadily — from SAR 2,193M in 2021 to SAR 3,594M in 2025. This is the broadest measure of what the business generates before stripping out various costs and adjustments.
Reported net profit is what ACWA officially publishes as its bottom line — the profit attributable to shareholders. This more than doubled from SAR 759M in 2021 to SAR 1,852M in 2025, which is the headline number the company highlights.
Adjusted net profit, which is the company's own version of profit after removing certain one-off items. It dipped sharply in 2024 to SAR 1,373M before jumping to SAR 2,196M in 2025.
The darkest orange bar is a significant measure of what ACWA's actual business earned — it removes the gains the company made from selling assets, leaving only the profit generated from running its power plants and projects.
In 2024, this figure dropped sharply to SAR 971M, which is notably lower than the SAR 1,757M that appeared in the net profit figures that year.
The gap between the two indicates that a significant portion of ACWA's reported 2024 profit did not come from selling electricity — it came from selling assets.
By 2025 the core figure recovered to an estimated SAR 1,632M, though it remains below the adjusted net profit figure for that year, suggesting asset recycling continued to play a key role.
When ACWA calculates its adjusted profit — the figure it presents as a refined measure of performance — it removes certain items it considers non-recurring. However, gains arising from the disposal of stakes in project companies are not among those removed.
The company's accounting policy classifies such transactions as part of its ordinary course of business, which means they flow through the adjusted profit line alongside revenue from power generation.
A useful illustration is the 2022 partial disposal of Sirdarya, a power plant in Uzbekistan, in which ACWA sold a 49% stake and recorded a cash gain of SAR 236 million.
Under the company's classification framework, this gain was retained within the adjusted profit figure for that year rather than treated as a separately disclosed exceptional item.
This is a legitimate and not uncommon accounting approach in asset-heavy infrastructure businesses, where portfolio management and capital recycling are considered core strategic activities.
It is worth noting that ACWA's definition of adjusted profit is broader than the definition some investors would use.
Where certain analysts would exclude asset disposal gains when measuring how much a business earns from its core operations, ACWA's adjusted figure retains them.
This does not make the number wrong — it simply reflects a different analytical lens, and investors should be aware of the distinction when using it to assess the underlying earnings capacity of the business.
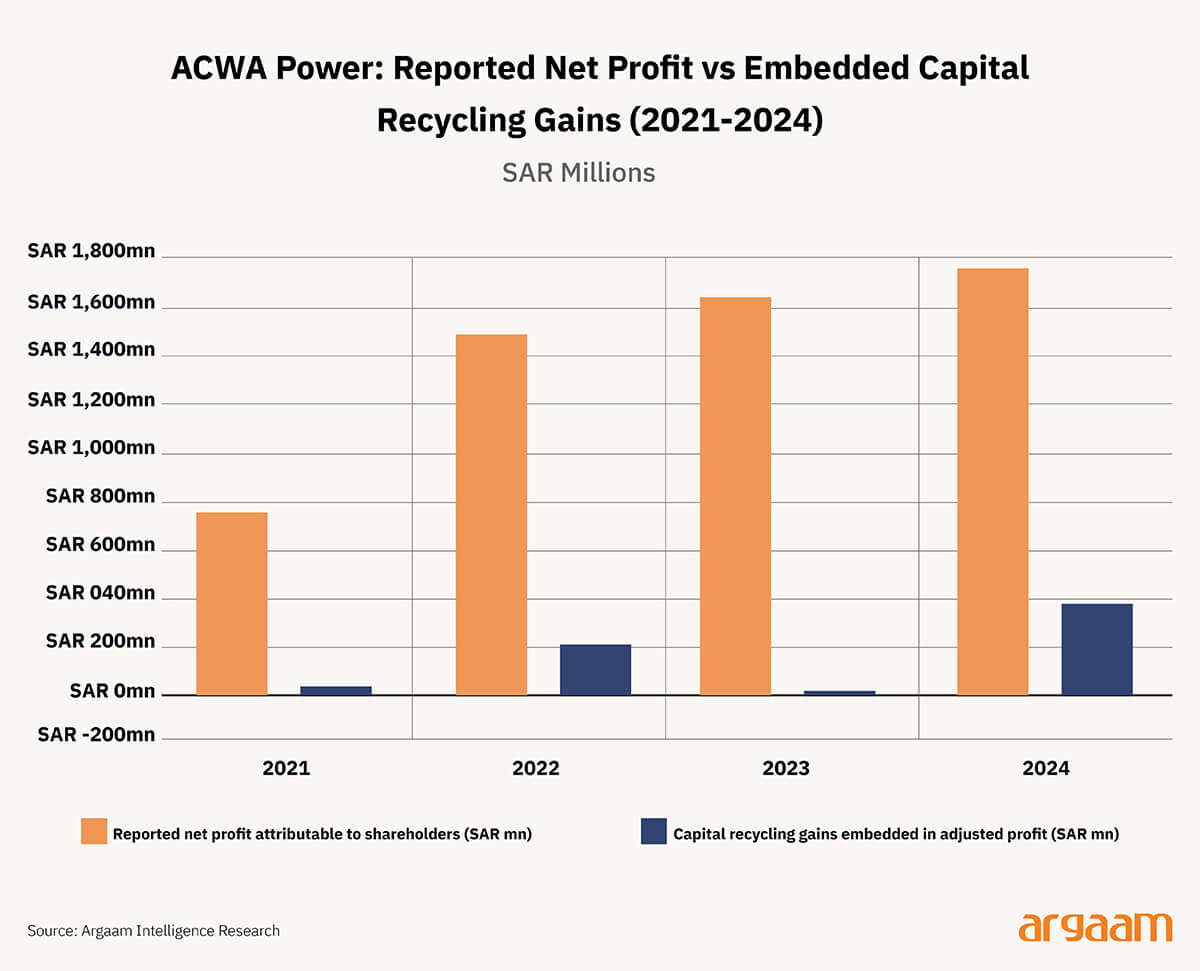
The classification of asset recycling gains as recurring income warrants analytical attention, given that their contribution to adjusted net profit has varied considerably from year to year.
Since ACWA's IPO in 2021, recycling gains represented approximately 15% of total reported net profit in 2022 and around 20% in 2024, while their contribution was negligible in both 2021 and 2023. This variability is visible in the chart below.
It is worth noting that 2025 has been excluded from this particular comparison. The reason is that ACWA Power changed the way it categorises and reports recycling gains in its 2025 accounts.
Because the reporting methodology differs from prior years, placing the 2025 figure alongside earlier years in the same chart would not produce a like-for-like comparison and could therefore generate an inaccurate impression of the trend.
Asset disposals are not the only category of income that warrants closer examination when assessing ACWA Power's adjusted profit figures. In 2025, the year in which the company reported its highest adjusted profits, the accounts include over SAR 1 billion classified under Other Operating Income.
Of this amount, more than SAR 500 million relates to an insurance claim and a legal settlement — two items that, by their nature, are unlikely to recur on a regular basis and are specific to particular events rather than reflective of ongoing operational activity.
In 2024, the picture presents a different nuance. A SAR 130 million reduction in finance charges remained within the adjusted profit figure, while a SAR 368 million debt restructuring gain was removed from it.
The two items were treated differently within the same reporting period, which raises a question worth noting for analytical purposes: the boundary between what is included in and excluded from adjusted profit does not follow a single consistent principle across all years and all items.
For investors seeking to understand the underlying earnings capacity of the business, this variability in classification makes it worthwhile to look beyond the adjusted profit headline and examine the individual components that contribute to it in any given year.
Sembcorp Industries, a listed energy company in Singapore that operates across Asia and the Middle East, makes for a good reference point in how ACWA’s capital recycling compares to the industry. The chart below shows Sembcorp’s net profit before and after exceptional items.
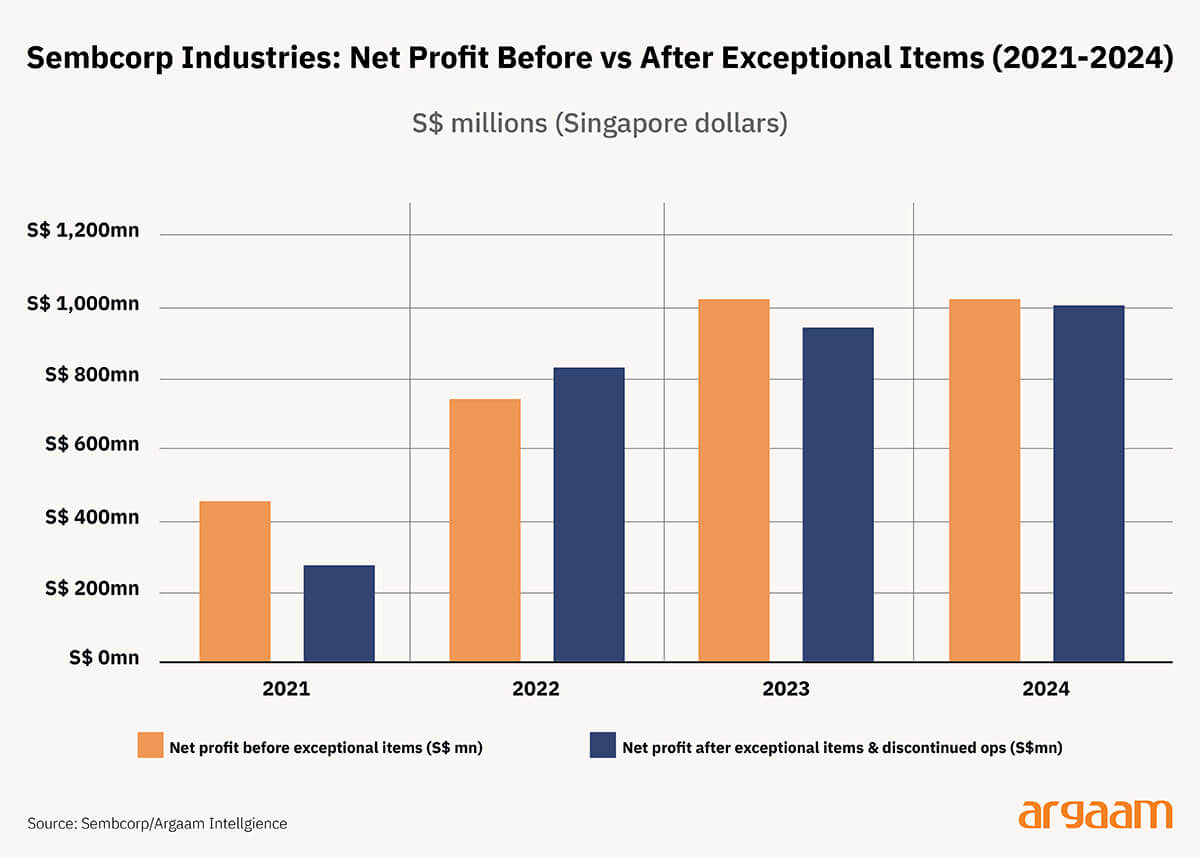
✦Note The large gap between the two bars in 2021 reflects a one-time event — the separation of Sembcorp Marine from the group — which was classified as a discontinued operation and excluded from the pre-exceptional profit figure.
From 2022 onwards, the gap between the two bars narrows considerably, meaning that exceptional items had a much smaller impact on reported profits in those years and the recurring earnings of the business became the dominant driver of the bottom line.✦
Sembcorp also recycles assets, but its figures more explicitly separate its capital recycling from its recurring earnings, classifying these items as exceptional regardless of the circumstances. This makes it easier to see how the underlying business performed in each year.
The key difference here is that the activity of the two firms is similar, but Sembcorp’s profit from long term, recurring cash flows is easier for investors to see, whereas ACWA embed what should be regarded as one-off cash flows into their adjusted net profit
✧ Conclusion✧
The funding round is not the finish line — it is just evidence that someone believed in the company at a point in time. What matters is what came after: whether the business kept growing, found an exit, or faded quietly. That is the only scorecard worth reading.