Saudi Arabia's 2023 Household Income and Expenditure Survey, which’s the latest available dataset and is our baseline in our argument, reveals average monthly household disposable income of SAR 18,056 and consumption of SAR 16,028, implying an 11.2% savings rate—dramatically higher than 2018's 1.6% (—approximately 749% increase in absolute savings).
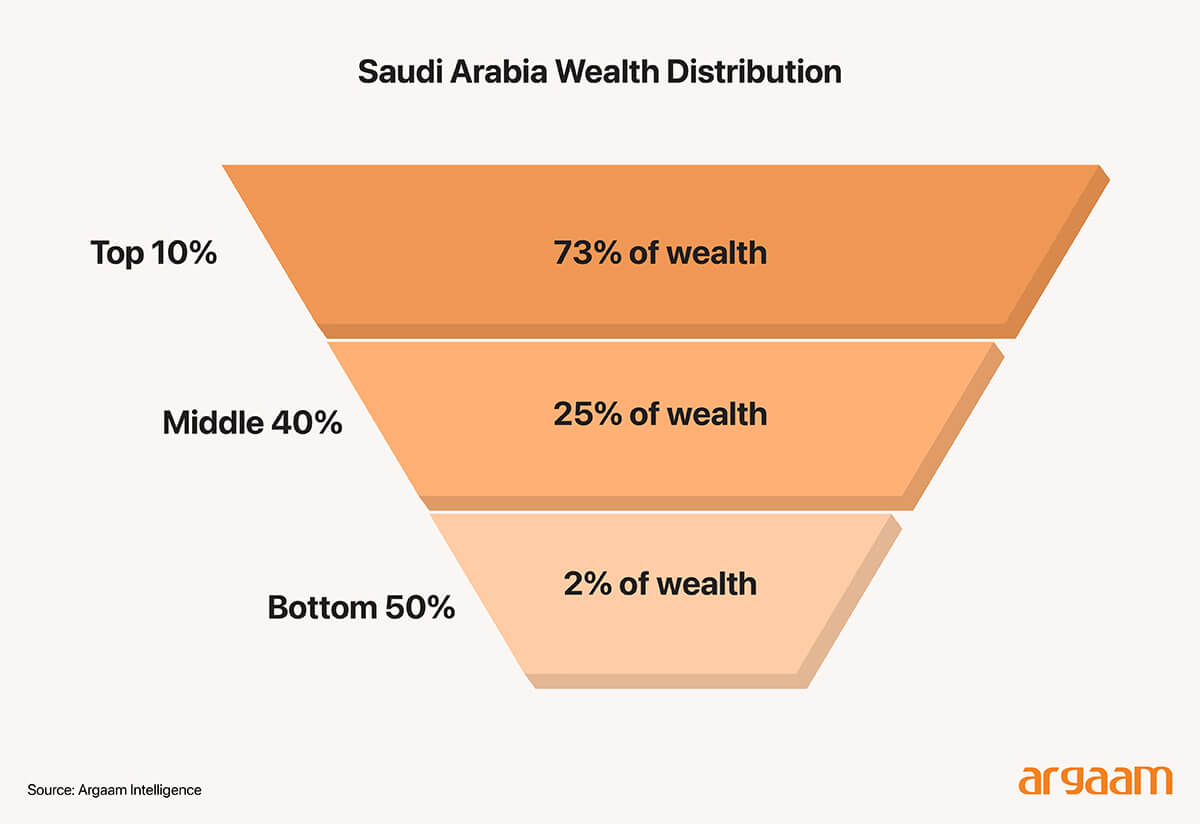
This apparent recovery suggests successful transition from spenders to savers. Yet this statistical improvement does mask severe financial fragility. The mean savings rate conceals extreme wealth concentration: Saudi Arabia's top 10% of households own 73% of total wealth, while 45% of households possess net savings below $10,000 and 45% have zero savings.
The median household income of SAR 13,655 lags 24% behind the mean of SAR 18,056 - indicating that aggregate improvement reflects wealthy household behaviour, and not broad-based financial health about a change towards a saving culture.
Empirical evidence does confirm debt-financed consumption drives apparent improvement in the saving ratio. Household debt reached SAR 471 billion in 2024, credit card lending surged by 16% y/y to SAR 31.37 billion, and Buy-Now-Pay-Later (BNPL) reached $1.31 billion in 2024 - with projections to grow to $1.48 billion in 2025.
Further, banking sector loan-to-deposit ratios climbed to 106-108%, indicating that banks relied more on external funding rather than household savings, suggesting a weak savings culture and dependence on borrowing to support spending.
Easy access to credit encourages more borrowing and spending financed by debt. Housing costs also take up a large part of middle-income families’ budgets—between 25% and 40%.
This creates a paradox: overall statistics show some improvements, but many middle- and lower-income households remain financially fragile and vulnerable.
ℹ︎
What are we testing in this report?
This report does not examine whether the household savings rate in Saudi Arabia is "high" or "low" based on statistical standards.
The real question we are testing is: Does the declared savings rate (11.2%) reflect the behavior of the majority of households, or is it a figure driven by a limited group of high-income households?
To answer this, the analysis distinguishes between: ● The statistical average ● The median income and actual savings behavior ● The true capacity to save after accounting for housing and debt obligations
Therefore, any interpretation that does not consider the distribution will be superficial, even if the numbers are mathematically accurate.
The Deceptive Arithmetic of Mean Savings Rates
The 2023 GASTAT survey documents average disposable income of SAR 18,056 and consumption of SAR 16,028, yielding a monthly savings of SAR 2,028 (i.e. 11.2% rate).
Compared to 2018's 1.6% (SAR 14,823 income, SAR 14,584 consumption, and SAR 239 savings), this represents approximately an increase of 749% in absolute savings.
Standard interpretation would celebrate successful structural adjustment to fiscal reforms (VAT tripling to 15%, and subsidy phase-outs) as such policies may encourage households tend to cut back on unnecessary spending, process their finances more carefully, and prioritize saving.
But, importantly, this collapses under distributional analysis. Saudi Arabia's Gini coefficient for wealth stands at 86.7—among the highest globally. The top 10% of households own 73% of wealth, while the bottom 50% hold less than 2%.
More critically, 45% of adults possess net worth below $10,000, and 45% have zero savings—unchanged in 2023 (which’s our baseline as noted in the start of this analysis) from 2018, despite apparent aforesaid increase in savings.
These realities render mean savings rates profoundly misleading: the average of SAR 18,056 reflects high-wealth households, and not median economic experience.
ℹ︎
Definitions
The Gini coefficient is a measurement of income or wealth inequality within a society. It ranges from 0 to 100 (or sometimes from 0 to 1, depending on the scale), where: ●0 indicates perfect equality (everyone has the same income or wealth). ●100 indicates perfect inequality (all income or wealth is concentrated in a single individual or household)
The median-to-mean income gap quantifies this distortion. While mean income reached SAR 18,056, median income stood at SAR 13,655—a 24% gap.
In normal distributions, median approximates mean; large gaps signal extreme inequality where high-income outliers inflate averages.
Applying proportional consumption behaviour, median households are estimated to save approximately 3-5%, and not 11.2%.
The aggregate improvement reflects wealthy households achieving savings rates of 15-20%, while middle and lower-income households (60-70% of population) continue dissaving.
ℹ︎
Definitions
● Mean income is the average income, calculated by summing all households' or individuals' incomes and dividing by the total number of those households or individuals. ● Median income is the middle point—half of the population earns less than this amount, and half earns more.
When the mean income is significantly higher than the median income, it indicates that a small portion of the population earns very high incomes, skewing the average upwards. This creates a large gap between the median (typical) income and the mean (average) income, highlighting inequality.
Global savings benchmarks provide context
Major OECD economies show household savings rates of 8-19% of disposable income (Germany 19.6% (Sept. 2025), France 18.4% Q3 2025, United States 4.7% (Sep 2025), and Euro Area 15.3% (Q4 2024).
With major emerging markets ranging higher (China 31.7% household savings in 2023; gross savings 43.4% of GDP in 2024, India 18.1% of GDP in 2024).
Saudi Arabia's median household savings rate of 3-5% falls substantially below both global and regional standards, confirming that the 11.2% aggregate figure may not fully capture the extent of financial challenges faced by many households, highlighting the importance of considering more granular perspectives to understand the broader context of the savings culture.
The regional context confirms Saudi Arabia's structural challenges in household savings. Among GCC countries, Saudi Arabia records the lowest gross savings rate—31.6-33.7% of GDP (2024-2025)—compared to Qatar (66.3%, 2022), UAE (42%, 2023), Kuwait (40.8%, 2023), and Bahrain (37.1%, 2023).
However, these national-level gross savings rates combine government, business, and household savings, reflecting oil revenue dynamics and fiscal positions, rather than household behaviour specifically.
GCC countries usually do not release detailed data on how much households are saving, which makes it difficult to directly compare the financial health of households across these economies.
Debt-Financed Consumption
If households genuinely improved savings, banking data should reflect rising deposits and declining loans. The opposite has occurred. Consumer loans reached SAR 471 billion in 2024.
Reflecting 6.6% y/y growth according to SAMA data, up from SAR 442 billion in 2023. Total household debt to GDP climbed to 31.6% in Q2 2025 from 28.2% in Q3 2023.
Credit card lending surged 16% y/y to SAR 31.37 billion ($8.4 billion) by end of 2024—four times the 4% household income growth implied by GASTAT surveys.
Following an all-time peak at end-2024, credit card loans remained elevated at SAR 30.66 billion in Q1 2025—just 2% below the record, sustained by Saudi Arabia's rapid shift toward cashless payments, with 79% of retail transactions now electronic.
Buy-Now-Pay-Later financing reached $1.31 billion in 2024, with projections to grow to $1.48 billion in 2025. Adoption is concentrated among younger demographics, with the 18-30 age group representing 52-53% of users.
Saudi Arabia's BNPL growth rate (10.8% CAGR, 2024-2029) exceeds the US (8.5%, 2025-2030) and UK (8.8%, 2025-2030) - suggesting credit expansion rather than savings-driven consumption.
The liquidity levels in the banking sector highlight an important point for further consideration. The Saudi banking sector's loan-to-deposit ratio climbed to 106-108% in Q2-Q3 2025, exceeding the 85-90% prudential threshold.
Ratios above 100% indicate banks lend more than depositors save, requiring wholesale funding. The sector-wide normal loan-to-deposit ratio reached 106.8% in Q3 2025, forcing banks to tap international markets for $33billion in 2025 alone —nearly three times the $10.5 billion borrowed in 2024.
If households saved 11.2%, deposit growth should outpace loans—yet loans grew 14.4% versus deposits at 7.8% (Q3 2025 y/y).
The mechanism is debt substitution for savings. Rather than accumulating emergency funds, households rely on credit access—viable only while available.
The structural shift from cash to credit accelerates this pattern: with nearly 50 million payment cards in circulation and 98% of in-person transactions now contactless, credit access has become frictionless.
With personal loans comprising 47% of total bank lending (SAMA 2024) and 45% maintaining zero savings, debt service burden is estimated at 15-20% of income for middle-income households.
Combined with housing costs of 25-40%, discretionary savings capacity compresses to near-zero for households earning monthly SAR 12,000-18,000 —precisely the median cohort.
Age-Cohort Analysis: concentrated fragility
Disaggregating by age reveals statistical improvement concentrates among older, asset-rich households, while younger and middle-aged cohorts demonstrate persistent fragility.
Saudi Arabia's demographic structure—63% under 30, and youth dependency ratio 28.3-32.5% (primarily children and teenagers who are not earning an income)—should support high savings during peak earning years (35-55).
Yet middle-aged households face mounting debt compressing savings capacity, while younger cohorts normalize credit-financed consumption.
Young Saudis (18-35) exhibit patterns incompatible with aggregate improvement. This cohort drives discretionary spending, with strong adoption of Buy-Now-Pay-Later services particularly among Generation Z, digital wallet usage growing significantly, and peer-to-peer payment platforms used by 39% of adults.
Credit card lending surged 21% y/y in Q2 2024, with growth concentrated in entertainment, dining, and e-commerce categories. Further, 33% planned to increase entertainment spending in 2025 (versus 19% globally), reflecting shifts from precautionary savings cultures.
Digital payment infrastructure removes spending friction and BNPL eliminates upfront barriers; social media-driven norms prioritize experiences over assets.
Financial literacy gaps compound tendencies. Saudi adults score 45.7% versus G20 average of 60.5%, with weaknesses in understanding compound interest and retirement planning.
Only a minority maintain adequate three-month emergency funds, leaving the majority financially vulnerable to income disruptions. Public sector employment expectations reduce savings urgency, yet only 10% work in the public or government sectors (2024).
Meaning that approximately 89% do face private careers or domestic work, which requires self-funded retirement.Middle-aged households (35-55) confront peak expenses eroding savings.
Mortgage obligations, children's education, and vehicle financing create fixed structures consuming 60-75% of monthly income.
ℹ︎
What does this mean for policymakers and the financial sector?
The results of this analysis indicate that the low saving rate in Saudi Arabia is not merely a matter of individual behavior or financial culture, but a structural consequence of limited financial headroom after covering housing and debt services.
Therefore, policies that focus solely on awareness or savings incentives are insufficient unless the root causes are addressed.
Practically, this implies that: ● Managing the debt service burden is just as important as increasing income ● Housing policies should be measured by the contribution ratio rather than the number of loans ● Expansion of credit tools (such as BNPL and payment cards) requires regulation that reflects their credit nature, not just consumption
Without restoring balance between debt and savings, statistical improvements will persist, while financial disparities remain embedded
Conclusion
There’s a policy paradox—zero income tax, and GOSI contributions increasing 9% to 11% (2025-2028)—fails to generate broad-based savings because structural incentives to consume overwhelm policy incentives to save.
The structural drivers —employment structure, credit availability, fiscal transitions, and housing dynamics—persist unchanged, confirming statistical gains reflect compositional effects, rather than systemic resolution.
While affluent households have notably augmented their savings, some vulnerable households have experienced a rise in debt levels. These contrasting developments have contributed to overall aggregate gains, potentially concealing underlying individual financial vulnerabilities.
Focusing policy efforts solely on average rates might overlook underlying disparities. To truly address the situation, it is important to consider measures that account for different socioeconomic circumstances—such as median savings rates, debt payments relative to income across various income groups, and how savings are distributed among wealth levels.
Implementing credit rules that set clear debt payment limits—such as keeping debt-service-to-income ratios below 40%—along with employment policies aimed at reducing wage gaps, and housing policies that limit mortgages to around 25% of income, could help strengthen household savings.
More this Weekend
M&As in US, Europe and GCC: Analysing Transaction Mindsets that Shape Deal Structures
In today’s M&A environment, deal structuring has become a central lever for both value creation and risk management. In the US and Europe, transactions particularly in the mid-market remain predominantly sponsor-driven, highly leveraged and control focused.
The Saudi Move from Isolated AI Pilots to Full Adoption in the Healthcare Sector to Reduce Revenue Leakage
Saudi hospitals have made real progress on digital transformation—but the next efficiency gains will come from intelligence, not more digitisation. In practical terms, the Kingdom now has a growing digital care layer (e.g., SEHA Virtual Hospital supports around 224 hospitals and is designed for large-scale virtual service delivery) and mass patient-facing uptake (the Sehhaty app reports 31M+ registered users).