




|
Written by Mohamed El-laithy Financial markets — including the Saudi Exchange (TASI) — play an increasingly role as one of the largest and fastest-growing markets in the region, and among the most prominent emerging markets globally. TASI boasts expanding economic diversity and a profound impact of structural reforms under Saudi Vision 2030. Amid this growth, understanding equity performance and the associated investment risks has become essential for investors and decision-makers. Alpha ‘a’ and Beta 'β' metrics serve as core analytical tools in evaluating performance and risk within financial markets. Alpha measures the excess return delivered by a stock or portfolio relative to its expected performance based on its risk level — a key metric for evaluating a stock selection skill and portfolio management efficiency. Conversely, Beta gauges a stock’s sensitivity to market volatility, providing insight into its systematic risks. This study aims to analyze Alpha and Beta across select TASI-listed equities to assess their performance and risk dynamics, and to explore whether opportunities exist for achieving excess returns given the unique the Saudi market characteristics. The study also differentiates between Traditional Beta, Upside Beta, and Downside Beta — offering a deeper reading of stock behavior during market upswings and downturns. This approach empowers advanced investment analysis and risk management decisions. In a related context, and within the broader framework of strategic portfolio diversification, the study introduces an independent investment portfolio designed to provide a balanced, sustainable alternative that is less dependent on market volatility and more reliant on the financial strength of the underlying companies — a strategy particularly suited to long-term investors. 
Analysis of Stock Behavior in Market Upswings and Downturns in Relation to Investor Profiles: Saudi-listed equities variably respond to market movements. Certain stocks tend to react strongly during market rallies – (High Upside Betas), while others show more stability or relatively limited declines during market downturns (Low Downside Betas). This type of analysis provides valuable insights into stock behavior, and links it best with investors, who can generally be categorized as follows: ● Speculative (High-Risk) Investors, who are willing to assume higher volatility in pursuit of rapid growth; ● Conservative Investors, who prioritize stability and minimize risk. Accordingly, the Upside Beta and Downside Beta analysis offers a more nuanced understanding of market sensitivity than traditional Beta alone — which may mask asymmetrical stock behavior across market cycles. This enhanced analysis enables investors to select securities aligned with their risk appetite and strategy, serving as a practical decision-support. Classification Methodology and Portfolio Building Based on Upside Beta / Downside Beta Based on calculated Beta metrics, this methodology provides a sophisticated framework for classifying equities according to their sensitivity to market trends, thereby facilitating the design of tailored portfolios that match each investor profile. The table below selects certain Saudi stocks illustrating variations in Upside and Downside Betas, which can be used to determine the most suitable investment approach for each investor type.
Practical Examples of Stock Behavior during Upswings & Downturns 1) Aggressive Portfolio The portfolio was built based on the selection of aggressive stocks with high Upside Beta values and a spread of < than 1, reflecting a strong reaction to market rallies and the potential for higher returns when the benchmark index rises.
Performance from January 2024 to End of October 2025 Analyzing the performance of the aggressive portfolio over this period shows a volatile and highly sensitive investment pattern in response to market movements, which aligns with the characteristics of high Upside Beta stocks. 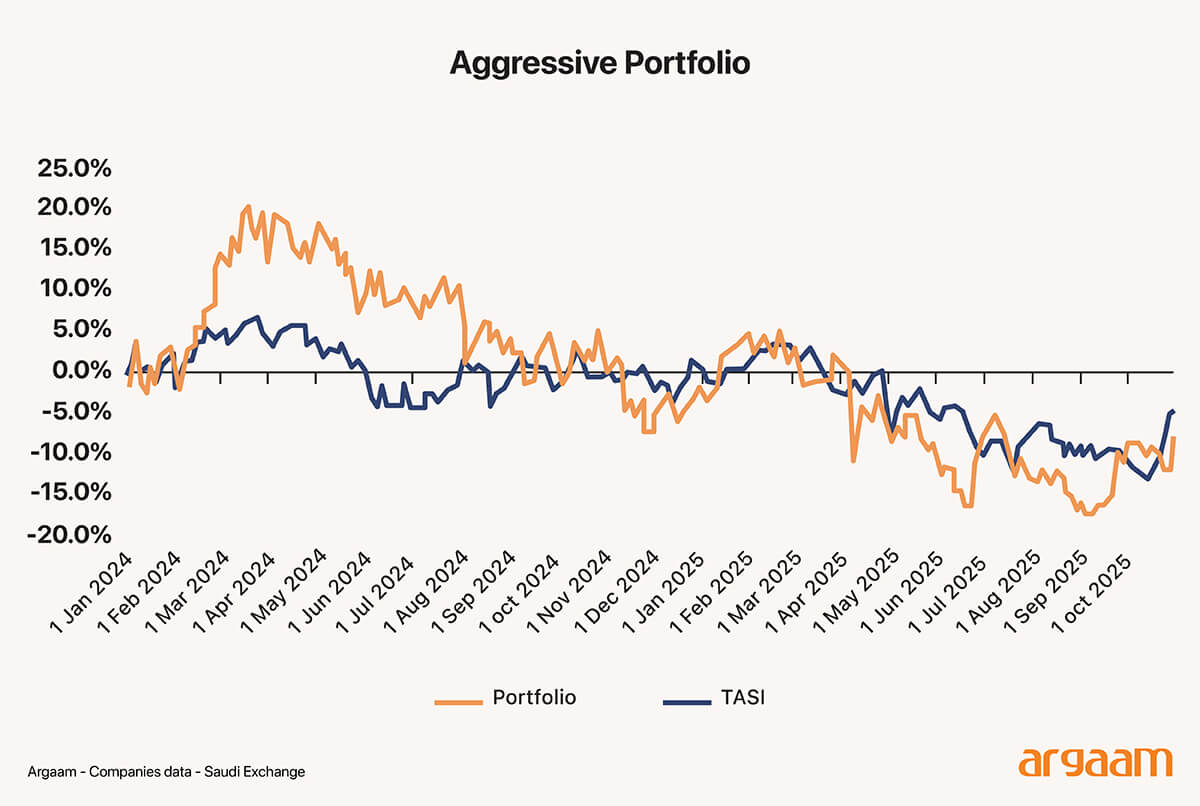 According to academic research, one key reason that investors have The portfolio recorded strong quarterly returns during market rallies, particularly in Q1 2024, when it outperformed the benchmark (TASI) with a return of 13.9% versus 4.4%, generating a positive Alpha of 9.5%. In Q1 2025, portfolio Alpha stood at 6.6% after recording a 3.7% return. 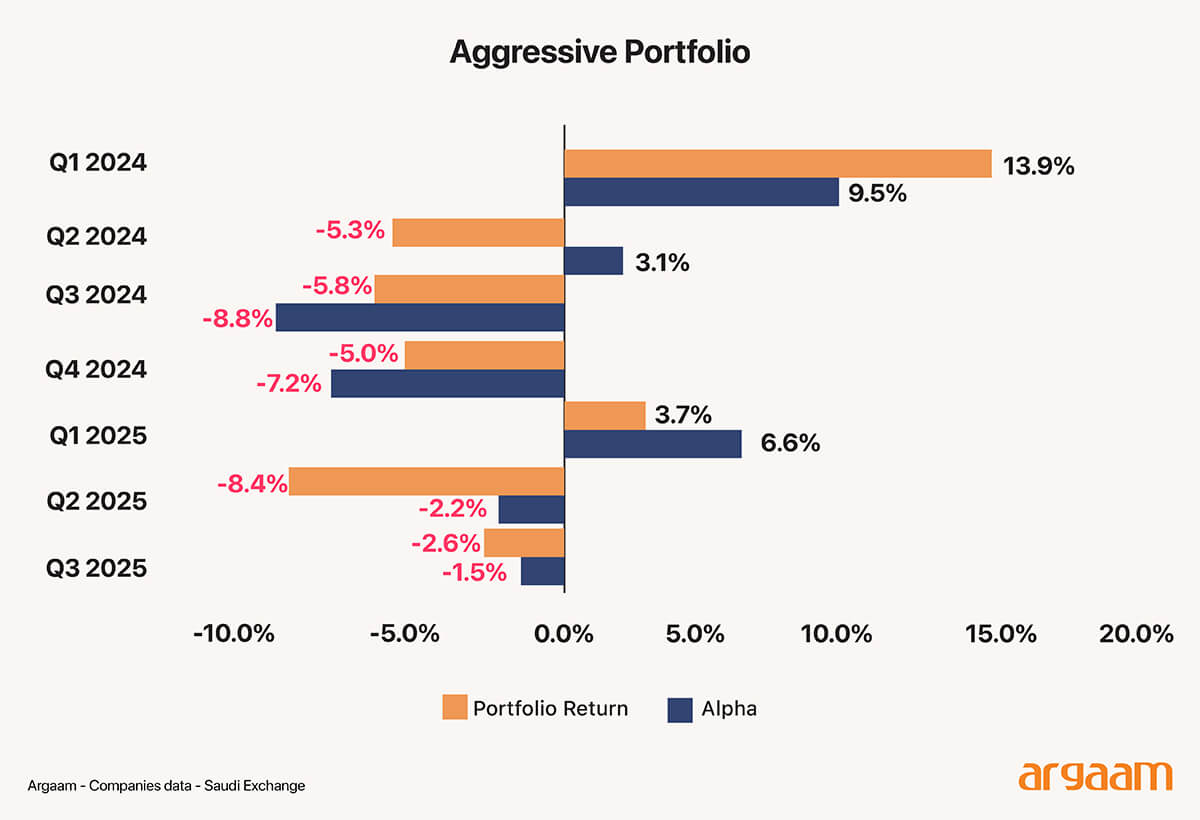
These results indicate that the aggressive portfolio can deliver outstanding returns with proper market timing but is also more exposed to sharp declines during bearish periods, making it a high-risk option not suitable for all investors. Thus, this portfolio type requires flexible risk management and a strategy aligned with market cycles. 2) Defensive Portfolio Defensive portfolios are best suited for conservative investors who prioritize stable returns and the avoidance of market volatility—especially during downturns or crises. This type of portfolio is composed of low-sensitivity stocks, generally showing Beta Up and Downside Beta values > 1, with a narrow or negative spread, reflecting a balanced response to both bullish and bearish movements.
Performance from January 2024 to End of October 2025 The defensive portfolio maintained lower volatility relative to the benchmark but did not fully protect against losses nor generate positive medium-term returns. 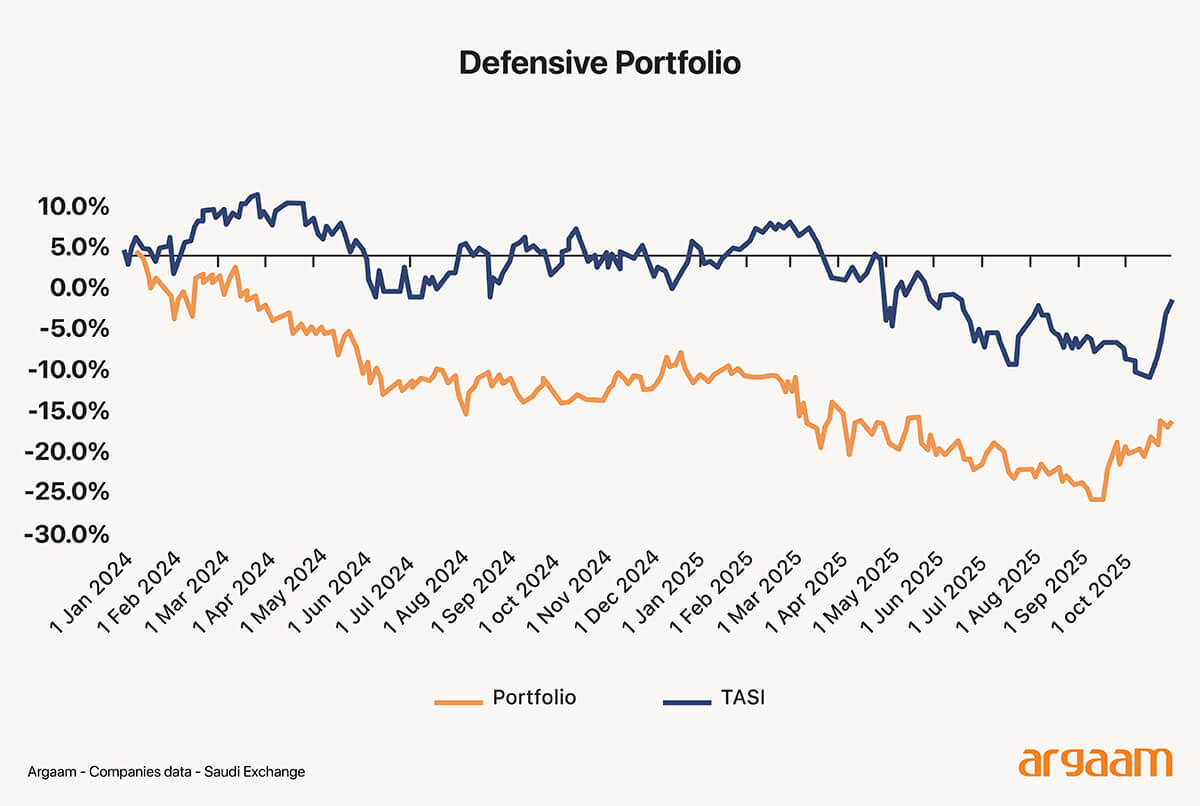 Annual losses reached -13.3% in 2024 versus -0.9% for TASI, producing a negative Alpha of -12.4%. In 2025, performance stood at -5.7% versus -4.9% for TASI, with a slight negative Alpha (-0.7%), reflecting broad market weakness. However, during certain periods—such as Q2 2024, when the portfolio dropped -8.6% versus -8.5% for TASI—it showed a reasonable defensive level. The portfolio also outperformed in specific months such as August 2024 (Alpha +4.8%) and September 2025 (Alpha +6.2%), demonstrating moments of relative resilience. 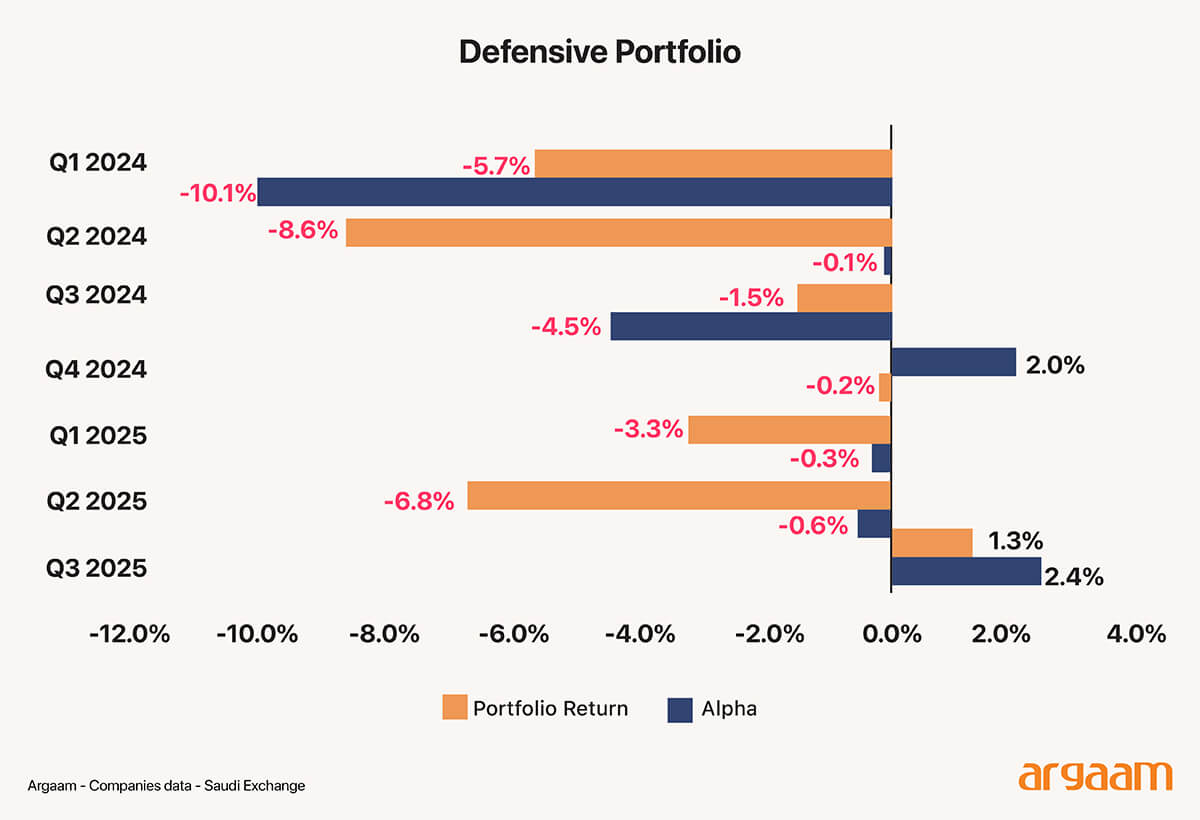
Scenario 3: Fundamentally driven and consistent payout portfolios This portfolio was created away from excessive sensitivity to short-term market fluctuations, in addition to selecting stocks characterized by strong financial fundamentals, in terms of stable cash dividends over several years, along with sustainable revenue growth, with the aim of achieving stable returns while enhancing the coefficient Alpha over the medium and long term.
Performance from January 2024 to October 2025-end: An analysis of the portfolio performance during a period characterized by clear market volatility showed that the portfolio succeeded in delivering outstanding performance compared to the benchmark index and the other two portfolios (aggressive and defensive). 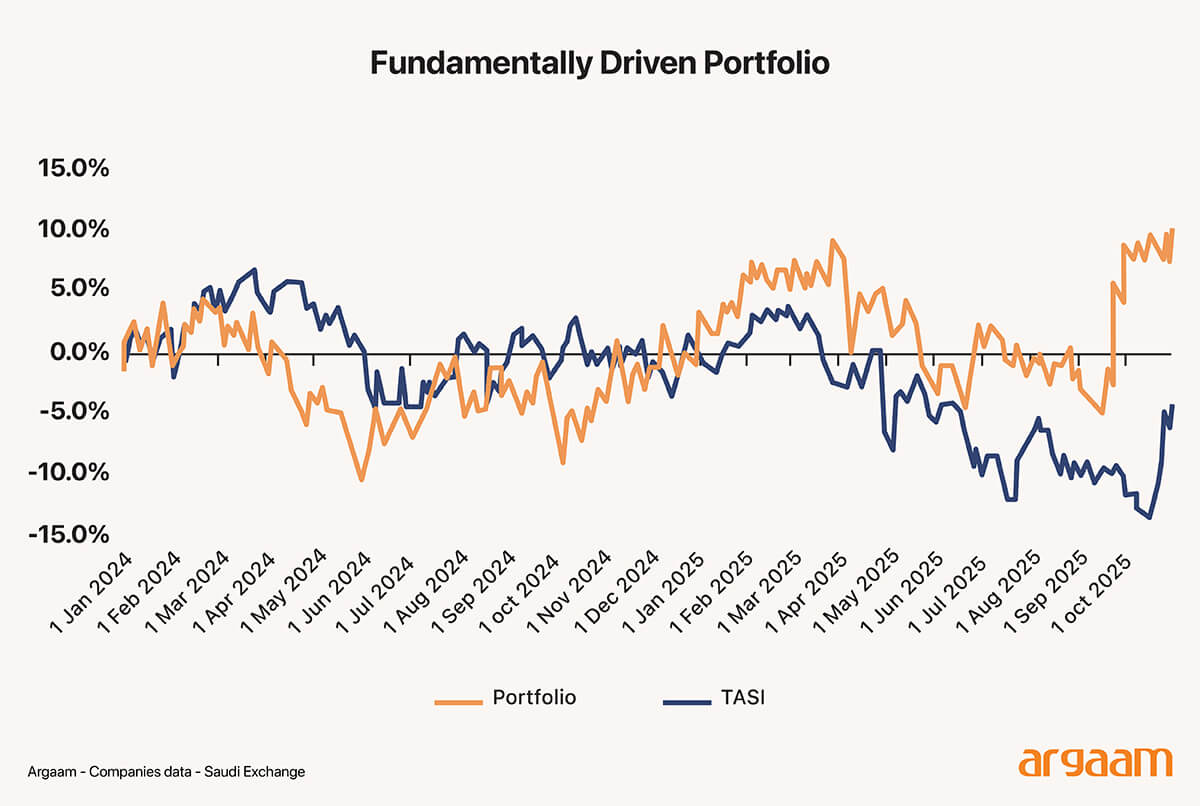 This was reflected in achieving positive returns in 2024 and 2025 despite the drop of the market index (TASI) during both periods by -0.9% and -4.9%, respectively. Meanwhile, the portfolio recorded a total annual return of +5.1% in 2025 compared to a -4.9% loss in TASI index, resulting in a strong Alpha of +10.0%. On a quarterly basis, the portfolio demonstrated defensive behavior during downturns, and an aggressive stance when growth opportunities driven by company fundamentals arose, which is usually reflected in the next results. This indicates that the portfolio benefits from the strength of its listed companies during both recession and economic recovery phases. 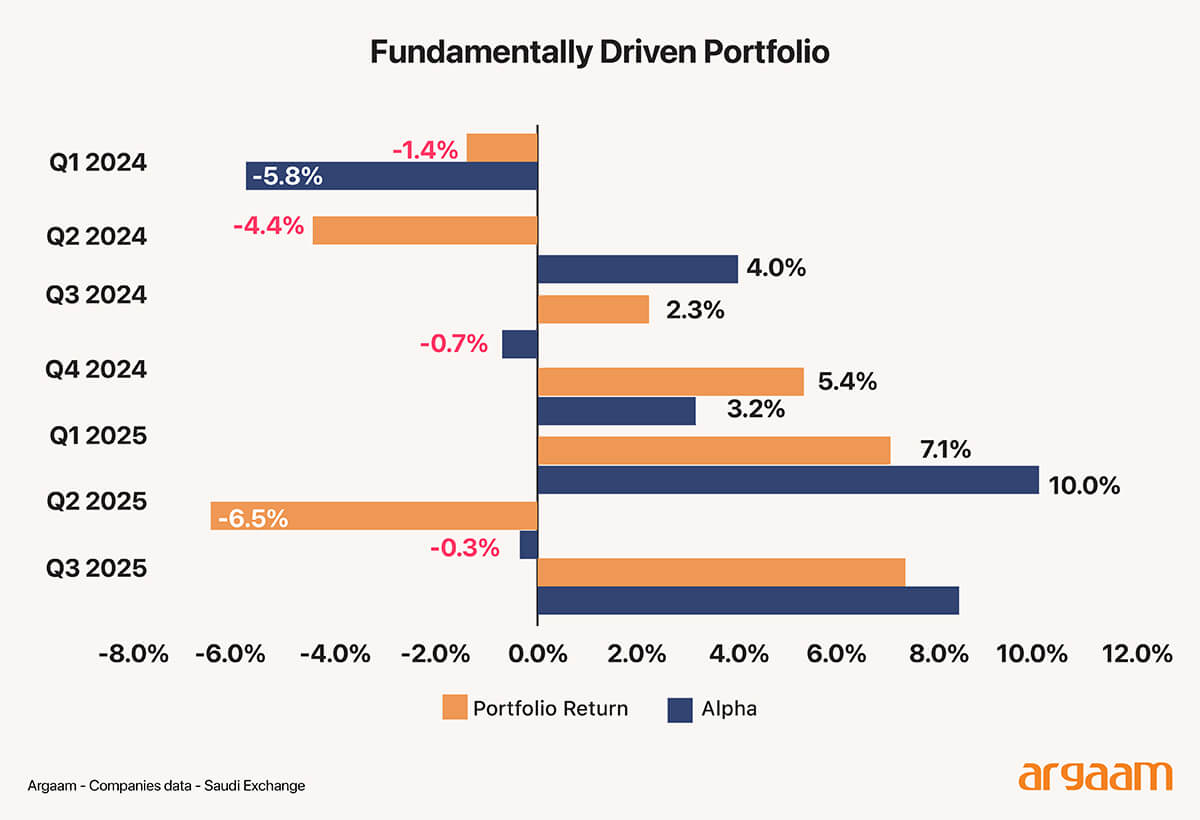 After reviewing three different categories of equity portfolios, the study’s results showed that the investment approach centered on financial fundamentals clearly outperformed other portfolio building strategies—whether aggressive or defensive. Through an analysis covering the period from January 2024 to October 2025, the financial fundamentals-based portfolio emerged as the best performer in terms of absolute return and Alpha, while maintaining a controlled level of risk. Although the aggressive portfolio showed significant improvement during uptrend periods, it suffered from sharp fluctuations during downturns. Meanwhile, the defensive portfolio provided good protection during market declines but did not achieve exceptional returns. The financially analytical portfolio, however, combined stable growth with consistent distributions, providing an ideal balance between risk and return. 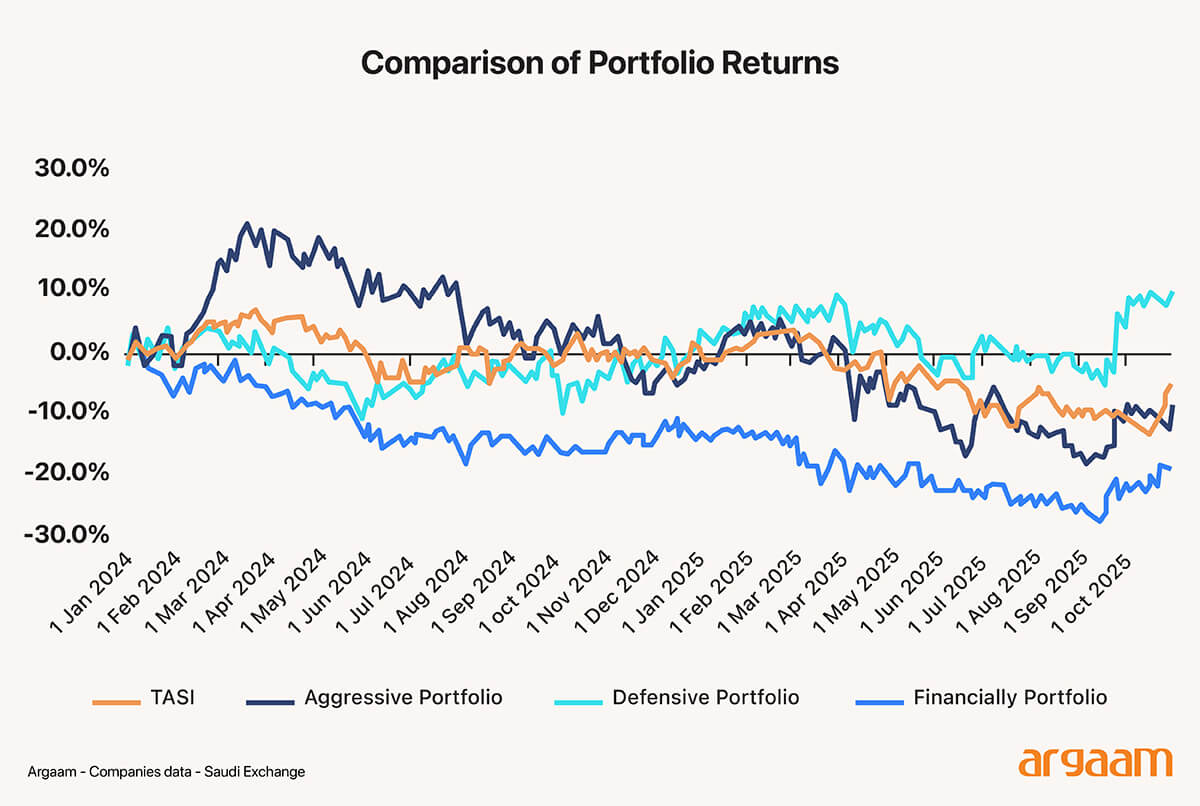 Finally, relying on strong financial criteria—such as revenue growth, profitability, and consistent cash payouts—serves as an effective foundation for building a portfolio capable of outperforming the general index while reducing excessive sensitivity to market fluctuations. Therefore, the financially driven approach is the most suitable for investors seeking real and sustainable returns over the medium and long term, even when markets go through exceptional periods. |
|
|

|

|


|

|