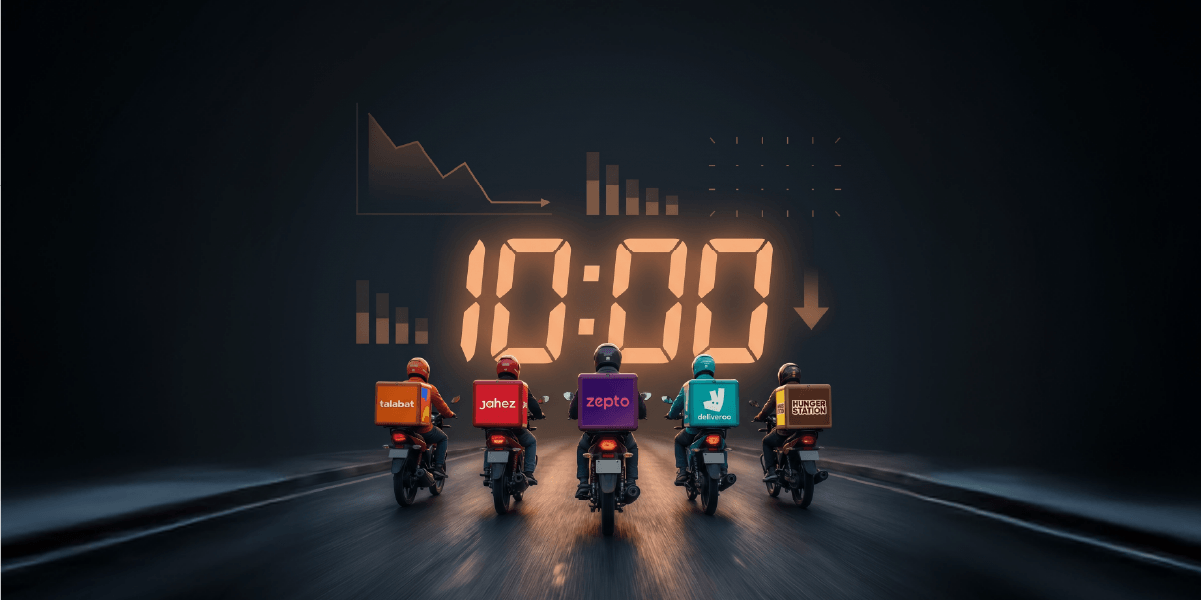
Zepto is an Indian quick commerce company racing to prove that ten-minute grocery delivery can generate sustainable returns. Al-Othaim is an established Saudi grocery retailer navigating pressure from every direction — competitors, thin margins, and a digital shift it is only partially keeping pace with.
One is growing fast but has yet to turn profitable. The other is selling more but earning less from every riyal of revenue.
What connects them is more significant than what separates them. As grocery retail migrates from a physical trip to a tap on a screen, the question that matters is no longer who grows fastest. It is who owns the customer relationship — and what can be built on top of it. That is the question this analysis examines through both businesses.
Zepto's Path to Profitability
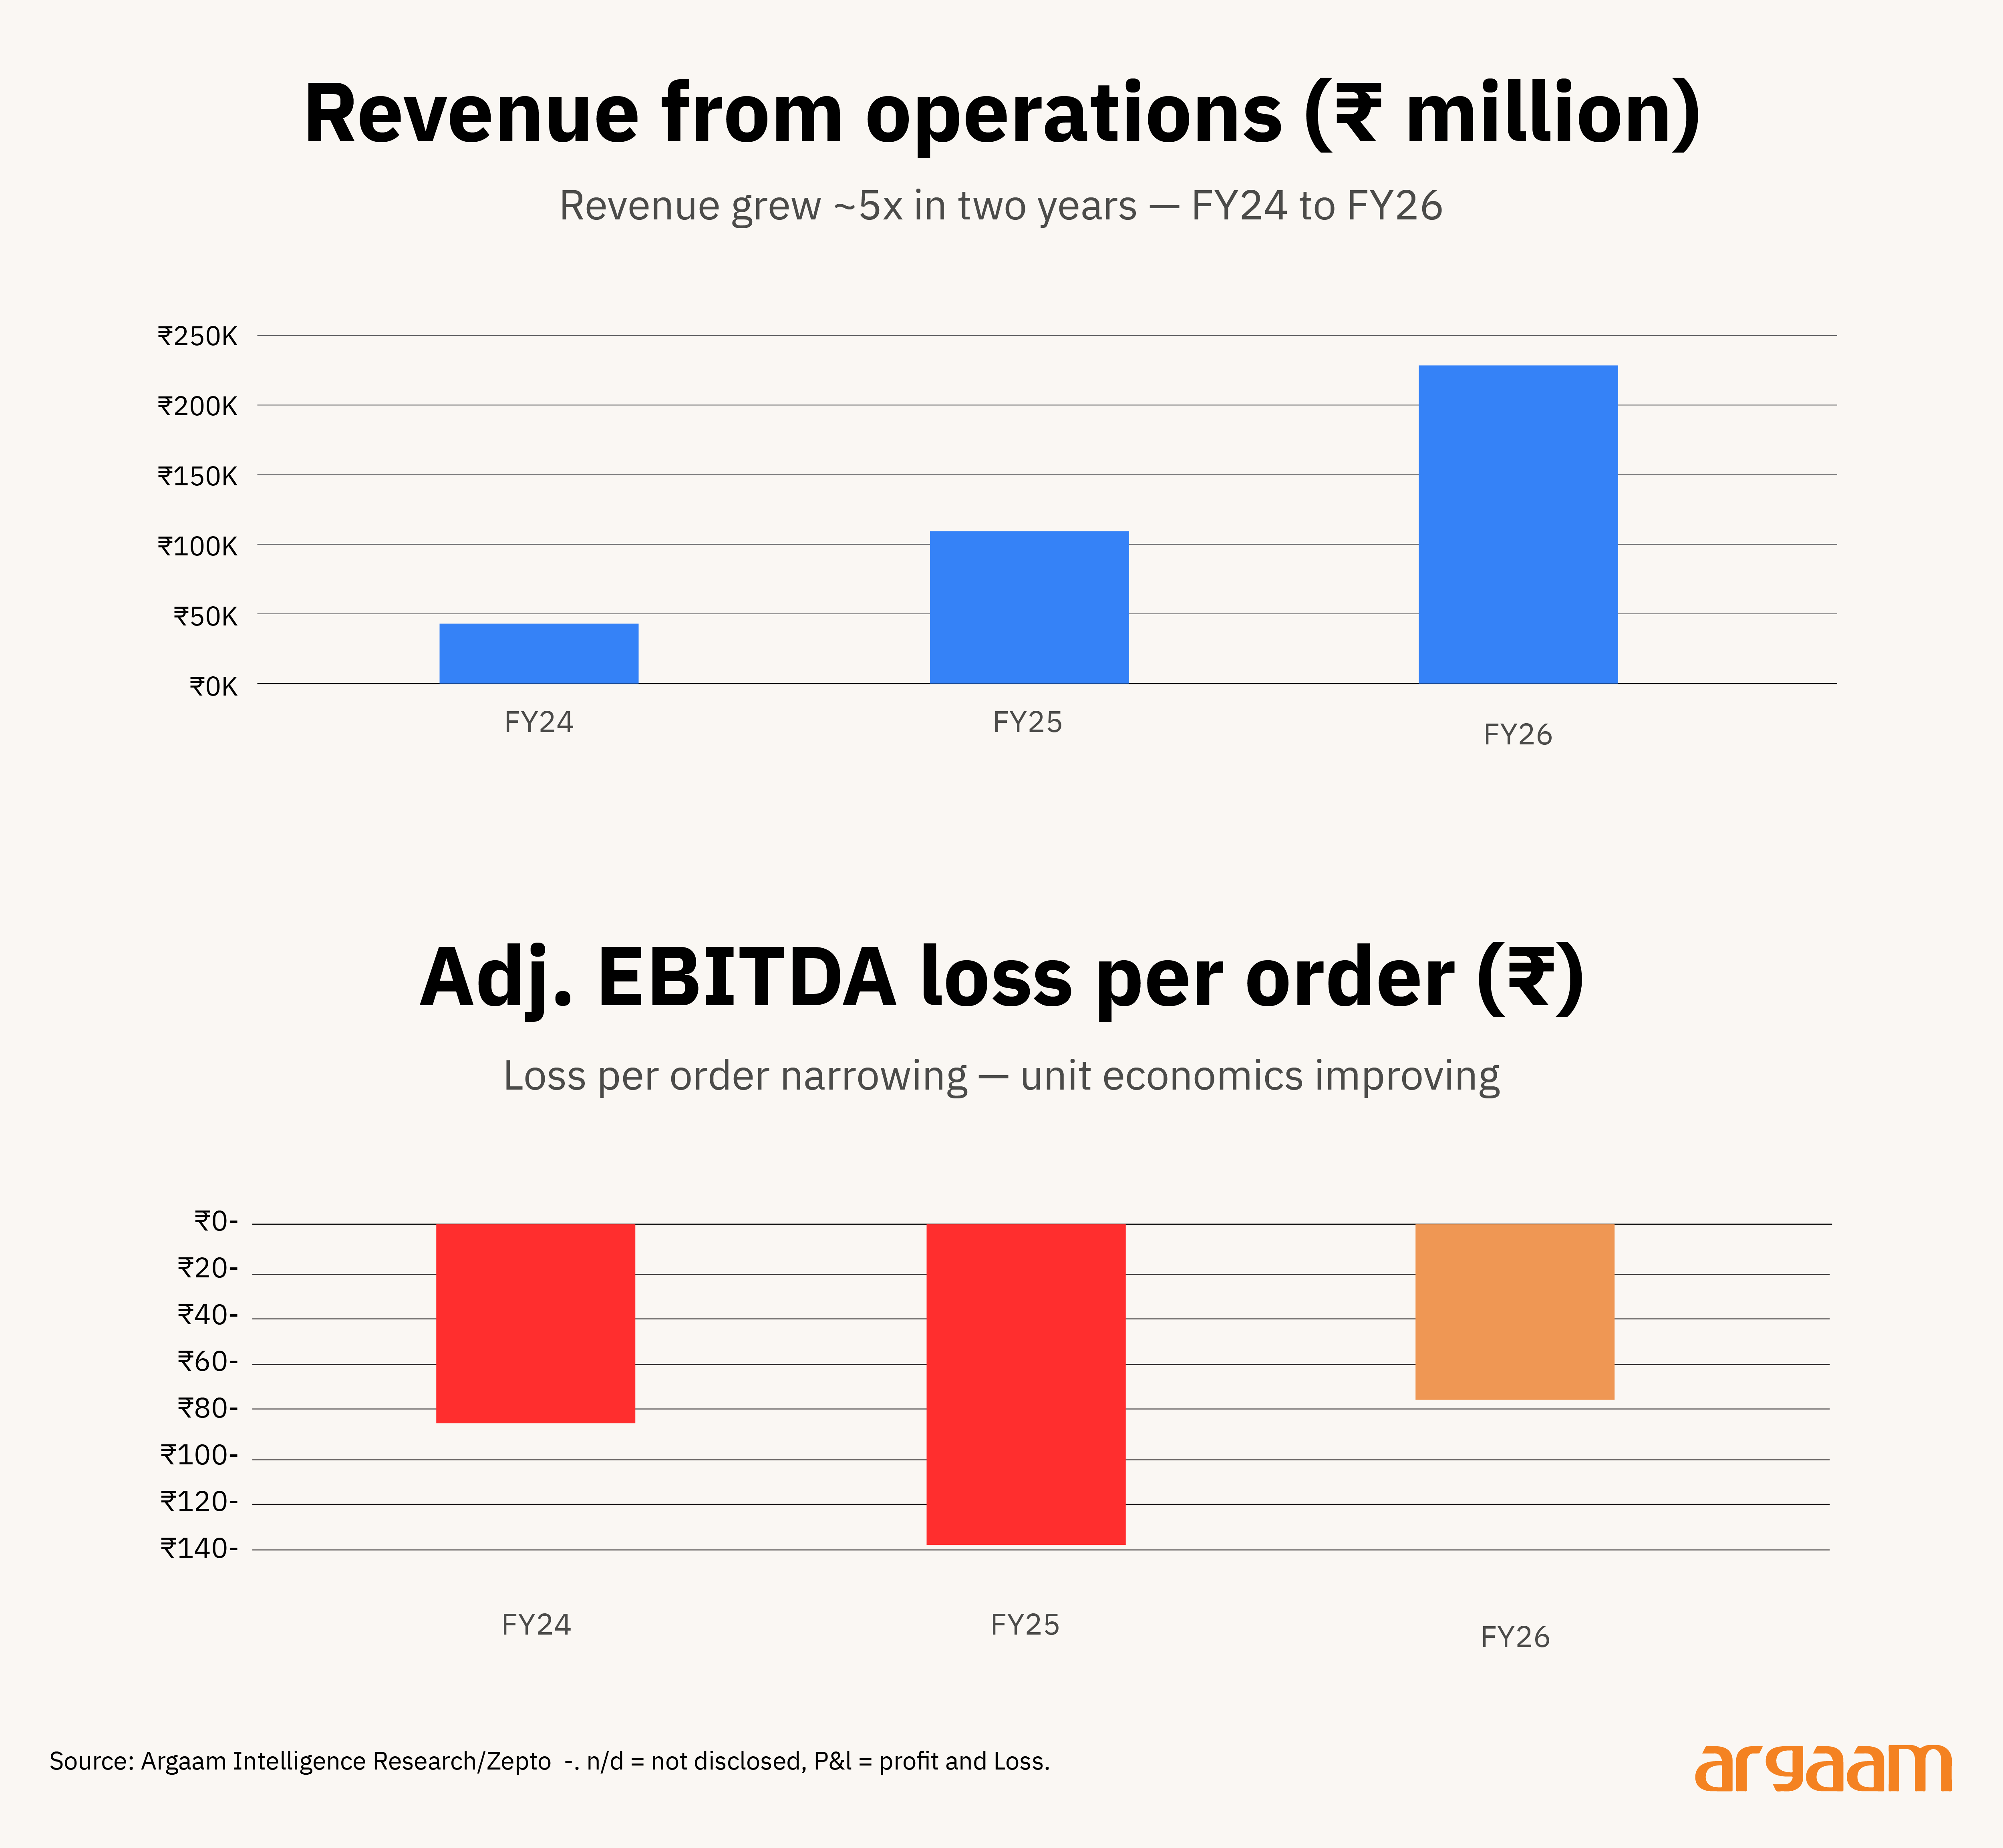
Zepto's growth story over the past few years has been remarkable — revenue up roughly 5x in two years, order volumes growing at a ~120% CAGR.
Its prospectus tells a story of improving unit economics. Reading between the lines, a few things merit closer attention.
Meaningful KPI comparisons across a wider peer set are limited: private operators (Getir, Gopuff) don't disclose unit economics, while listed players (Talabat, Blinkit, Instacart) disclose selectively and run differing business models.
A classic J-curve — dark store profitability is a density game
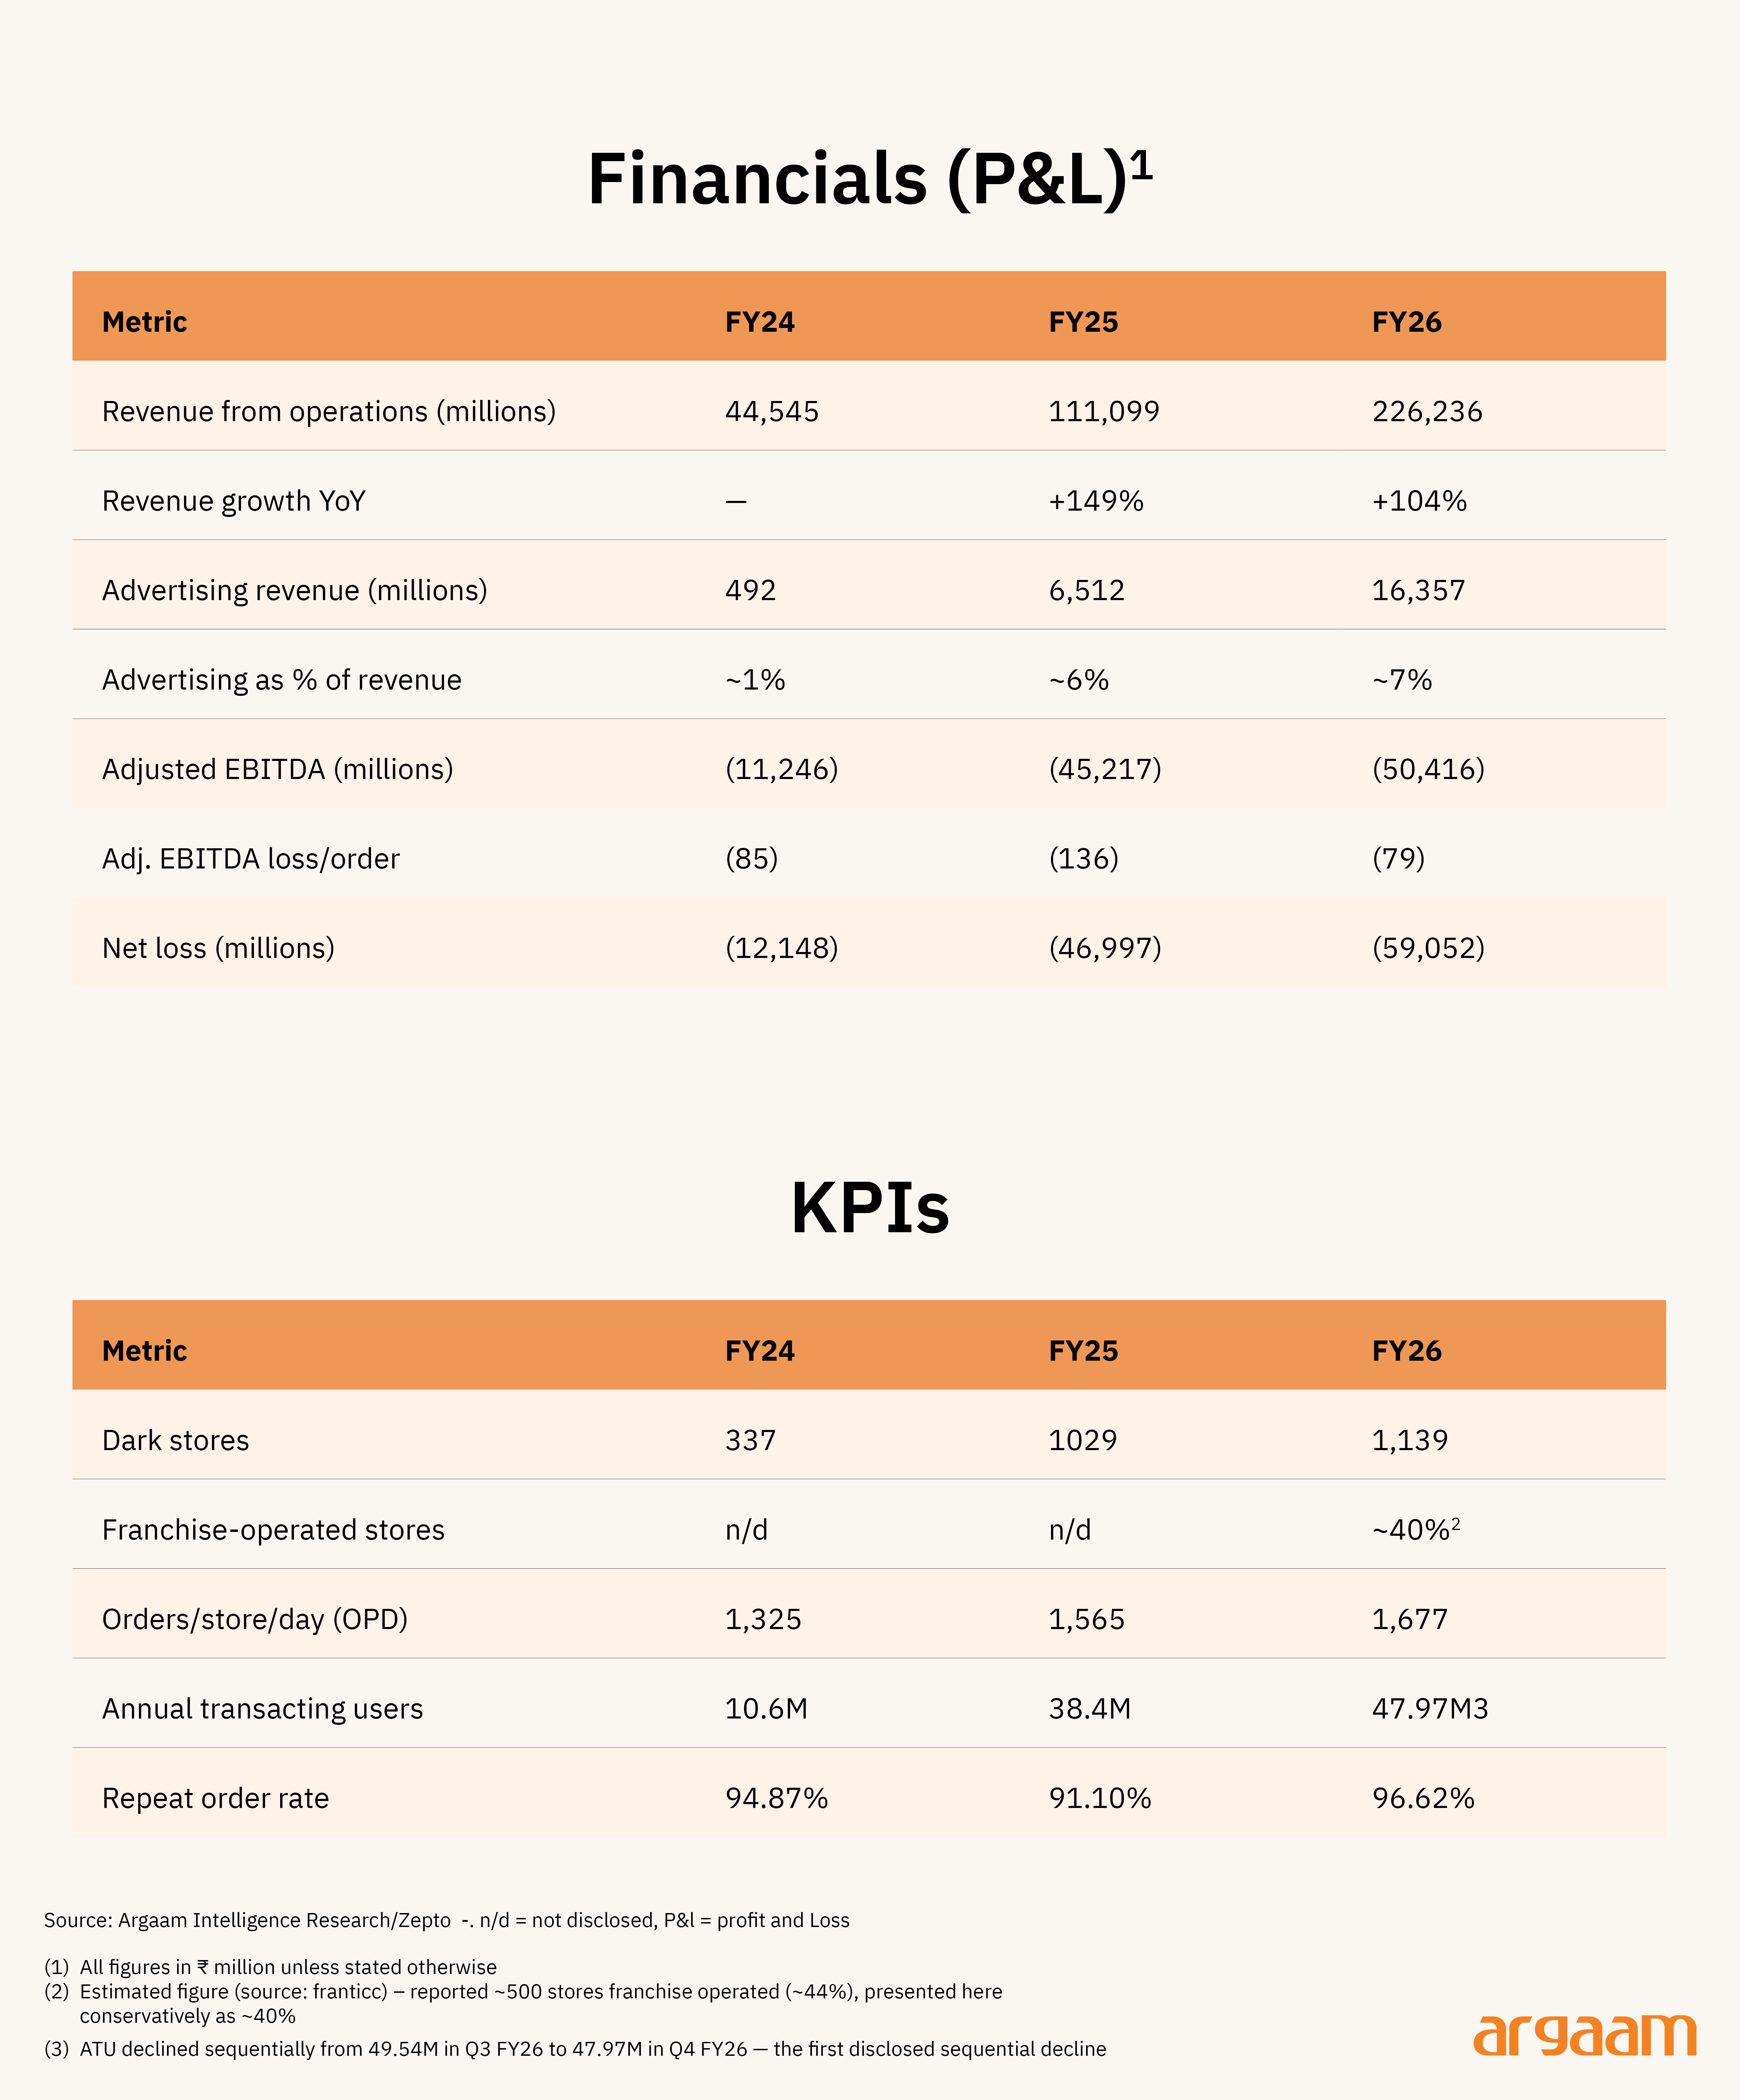
The J-curve effect describes how per-order economics get worse before they get better as an operator expands. Zepto's Adj. EBITDA loss per order moved from a trough of ₹136 in FY25 to ₹79 in FY26, improving further to ₹59 in Q4 FY26 alone.
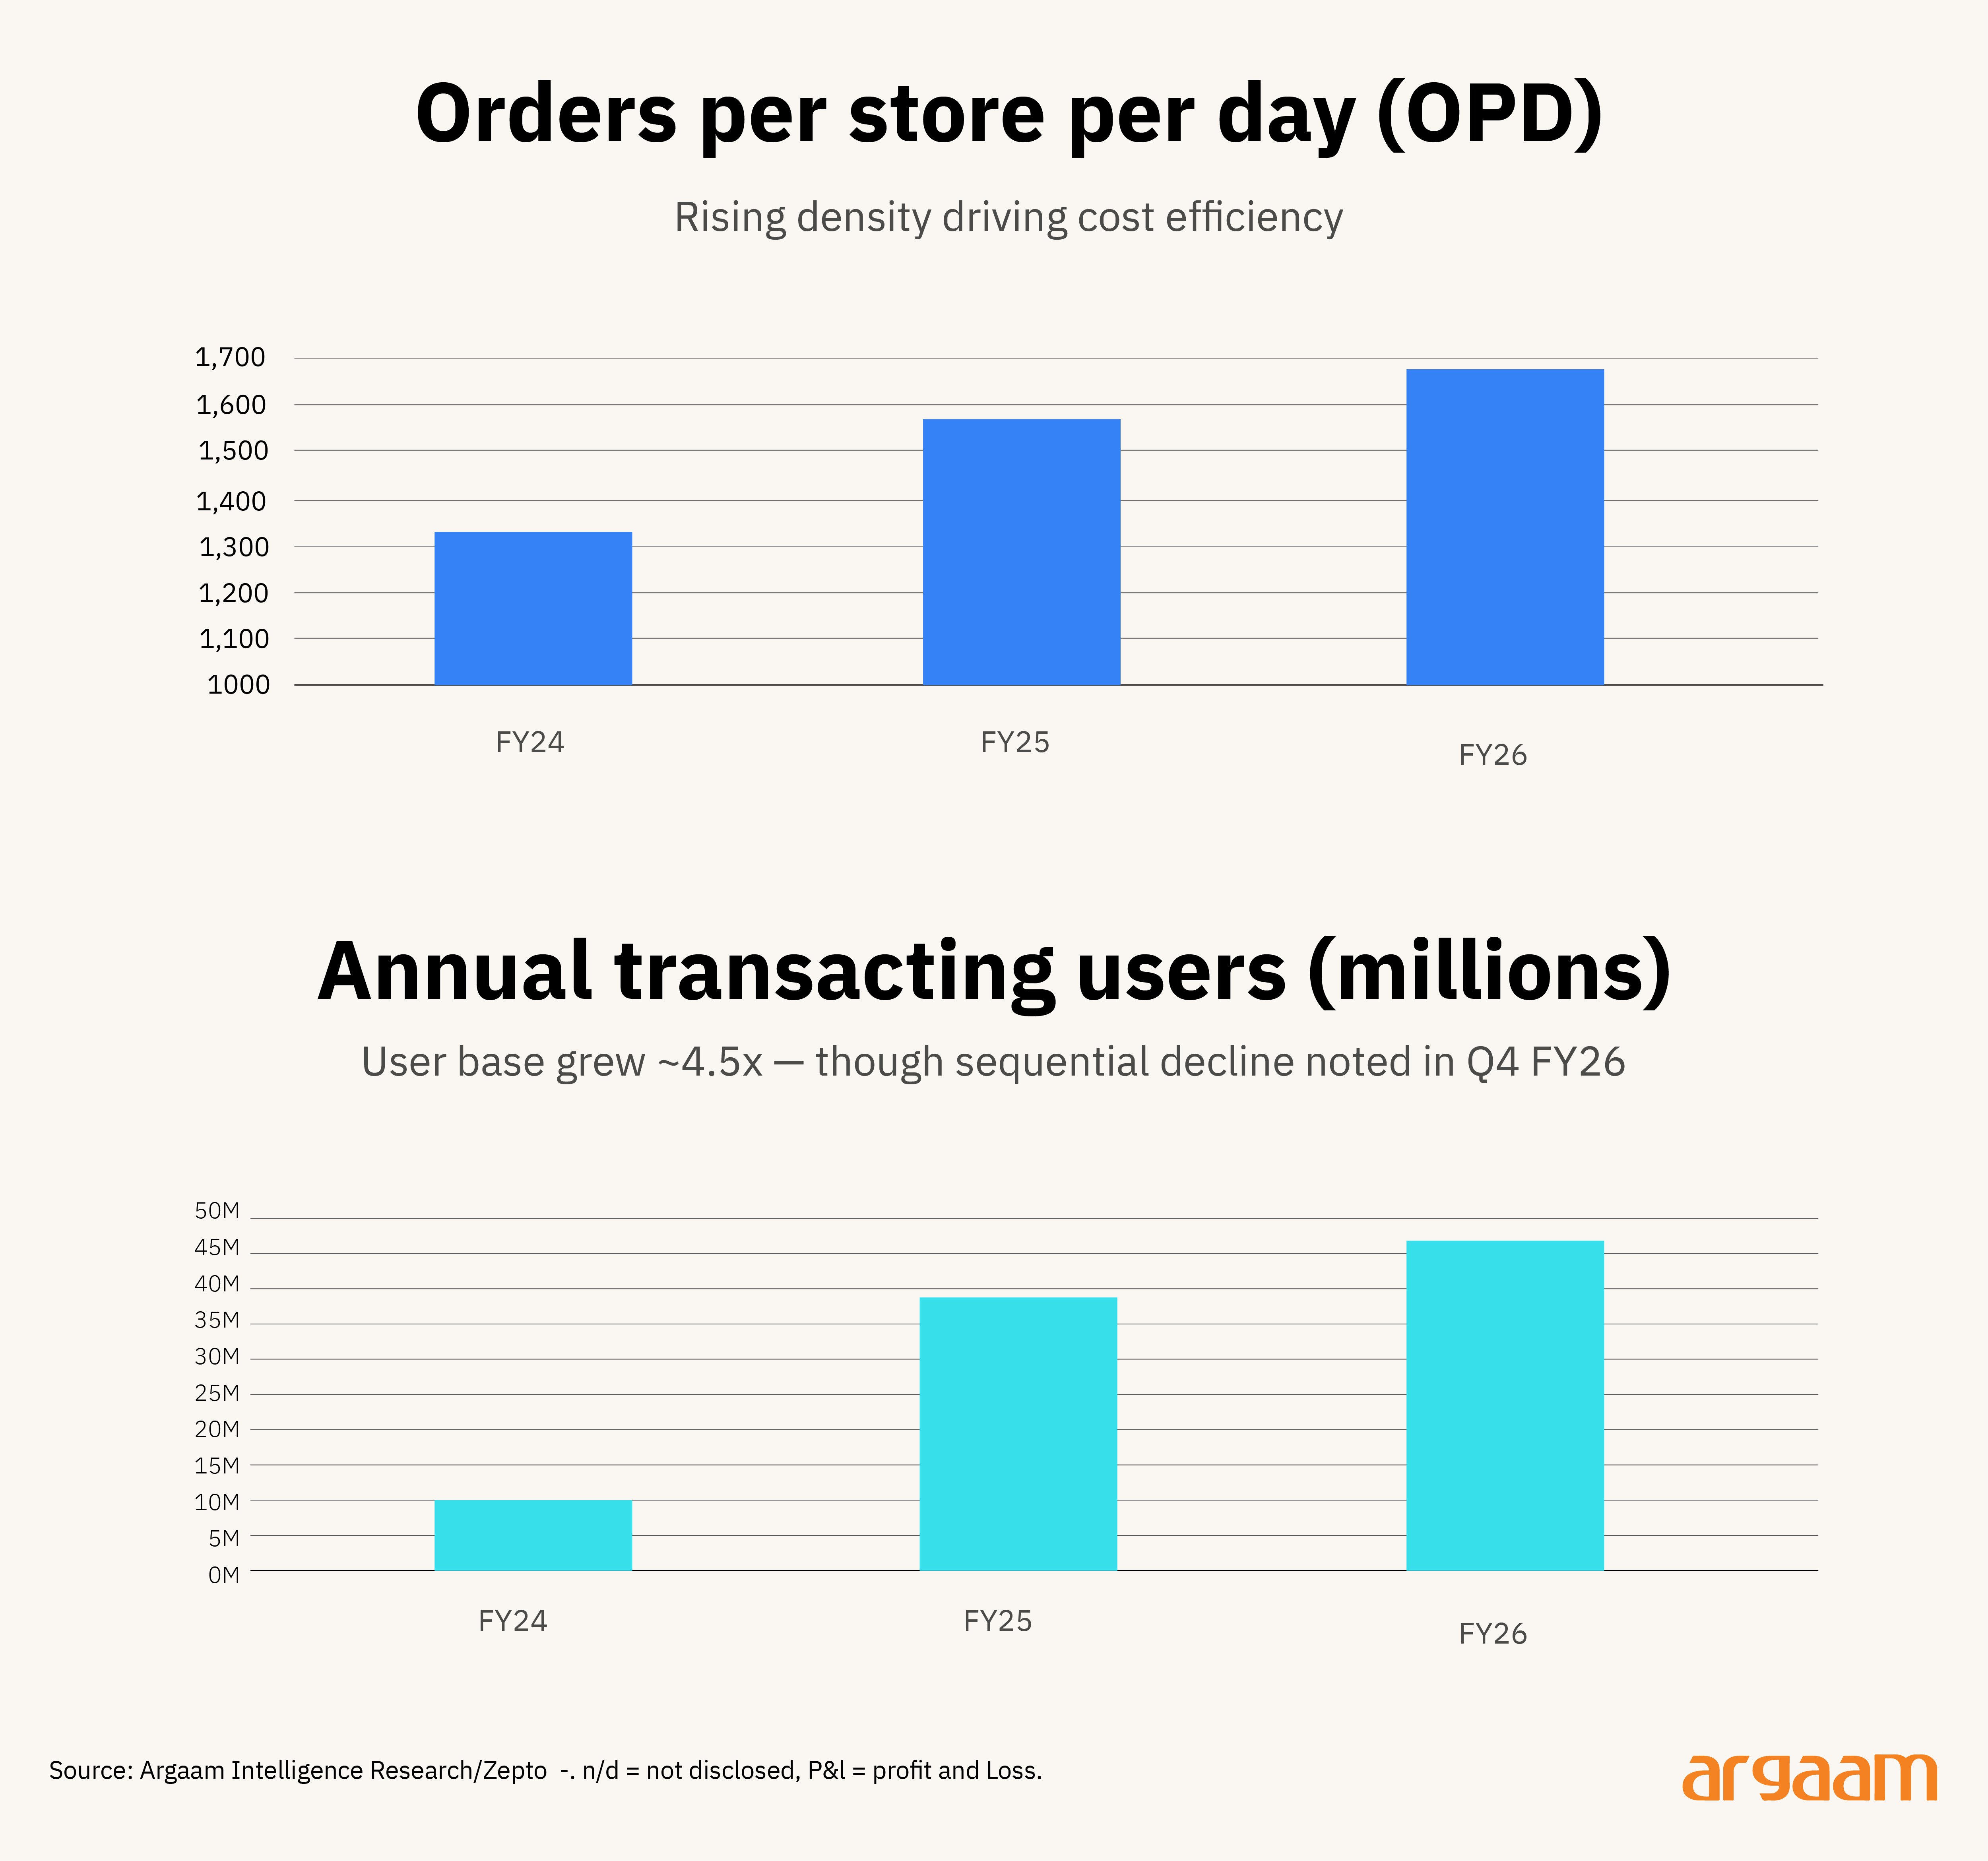
The more orders a single dark store processes each day, the more profitable it becomes — fixed costs spread across more deliveries. Zepto's orders per store per day rose from 1,325 in FY24 to 1,677 across FY26, reaching 2,140 in Q4 FY26 alone — the strongest quarter yet. But average spending per order has barely moved from ₹388–₹394 — meaning volume alone is carrying the improvement.
Delivery distance is messier: it fell from 2.05 km (FY24) to a low of 1.73 km in FY25 but has since risen for two consecutive periods to 1.78 km (FY26 annual) and 1.83 km in Q4 FY26.
Shorter delivery distances mean faster deliveries and lower costs per order. The recent rise back toward 2 km suggests Zepto is expanding into lower-density areas where dark stores are further from customers — a sign that the easiest, most profitable urban markets are becoming saturated.
The two density signals are supposed to move together: right now they're diverging, and it's worth watching whether that reverses. The expansion phase is the most dangerous period and needs to be carefully navigated.
Profitability comes from more orders flowing through existing infrastructure, not bigger baskets. Zepto’s NRV (Net Receivables Value) per order held roughly flat at ₹388-₹394 across FY24-FY26, even as total order volume grew nearly 5x over the same period (~133 million to ~640 million).
So Zepto's revenue growth has come almost entirely from volume — more customers placing more orders — not from each customer spending more each time they order.
Whether a dark store is profitable depends on several variables specific to that location — how much rent it pays, how much customers spend per order, and how the operation is structured.
These differ store by store, which means there is no single order volume at which all stores become profitable. The most useful metric for understanding this would be the contribution margin per order — essentially whether each additional order a store processes is already making money before the store's fixed costs are counted.
If one more order generates more revenue than it costs to fulfill, the store is moving in the right direction regardless of whether it has covered its rent yet. The problem is that Zepto has not disclosed this figure in its prospectus.
Without it, it is difficult to know precisely how close the business is to genuine order-level profitability — which is the number that matters most for assessing when and whether the unit economics will turn positive at scale.
Blinkit is the only comparable quick commerce business to have publicly disclosed its journey from loss-making to breakeven at order level. It moved from losing 17.8% of net order value on every order in FY23 to a marginal profit of 0.3% in Q4 FY26 — a turnaround that took roughly three and a half years.
The mechanisms were identical to what Zepto is pursuing: more orders per store per day, improving contribution margins, and growing advertising revenue from brands paying to appear on the platform.

Absolute losses are widening even as per-order losses improve — the investor's dilemma
The per-order recovery above needs to be read alongside a starker number: net loss grew from ₹12,148 million in FY24 to ₹59,052 million in FY26 (roughly 5x) over the exact period adjusted EBITDA loss per order improved 42% off its FY25 peak.
The explanation is that order volumes grew, driven by both density gains and store expansion, faster than per-order economics improved. New stores lose money before they mature, so each wave of expansion adds losses to the network faster than the maturing stores can offset them.
The gap between EBITDA and net loss is widening too, as Zepto capitalises heavily on its buildout, takes on more financing obligations and issues more employee stock compensation. None of which shows up in EBITDA but impact the bottom line.
Zepto is losing less money on each order — genuine progress. But it is processing far more orders, so the total loss keeps growing. Both things are true simultaneously.
Focusing only on improving per-order economics misses how much capital the overall business still consumes. The upcoming IPO is raising money precisely to fund the gap between where unit economics are today and where they need to be.
Repeat order rate looks strong — the cohort data underneath it doesn't
When a customer returns repeatedly, the cost of acquiring them — the marketing and incentive spend used to bring them onto the platform originally — gets spread across all their future orders. The more times they order, the cheaper each order becomes from an acquisition cost perspective, improving the overall economics.
Zepto's numbers show this working in real time: digital marketing cost per order fell from ₹10.82 in Q1 FY24 to ₹1.01 in Q4 FY26, a 91% reduction, alongside a 96.62% repeat order rate in FY26, though that repeat rate wasn't a linear progression. It dipped to 91.10% in FY25 before recovering, up from 94.87% in FY24.
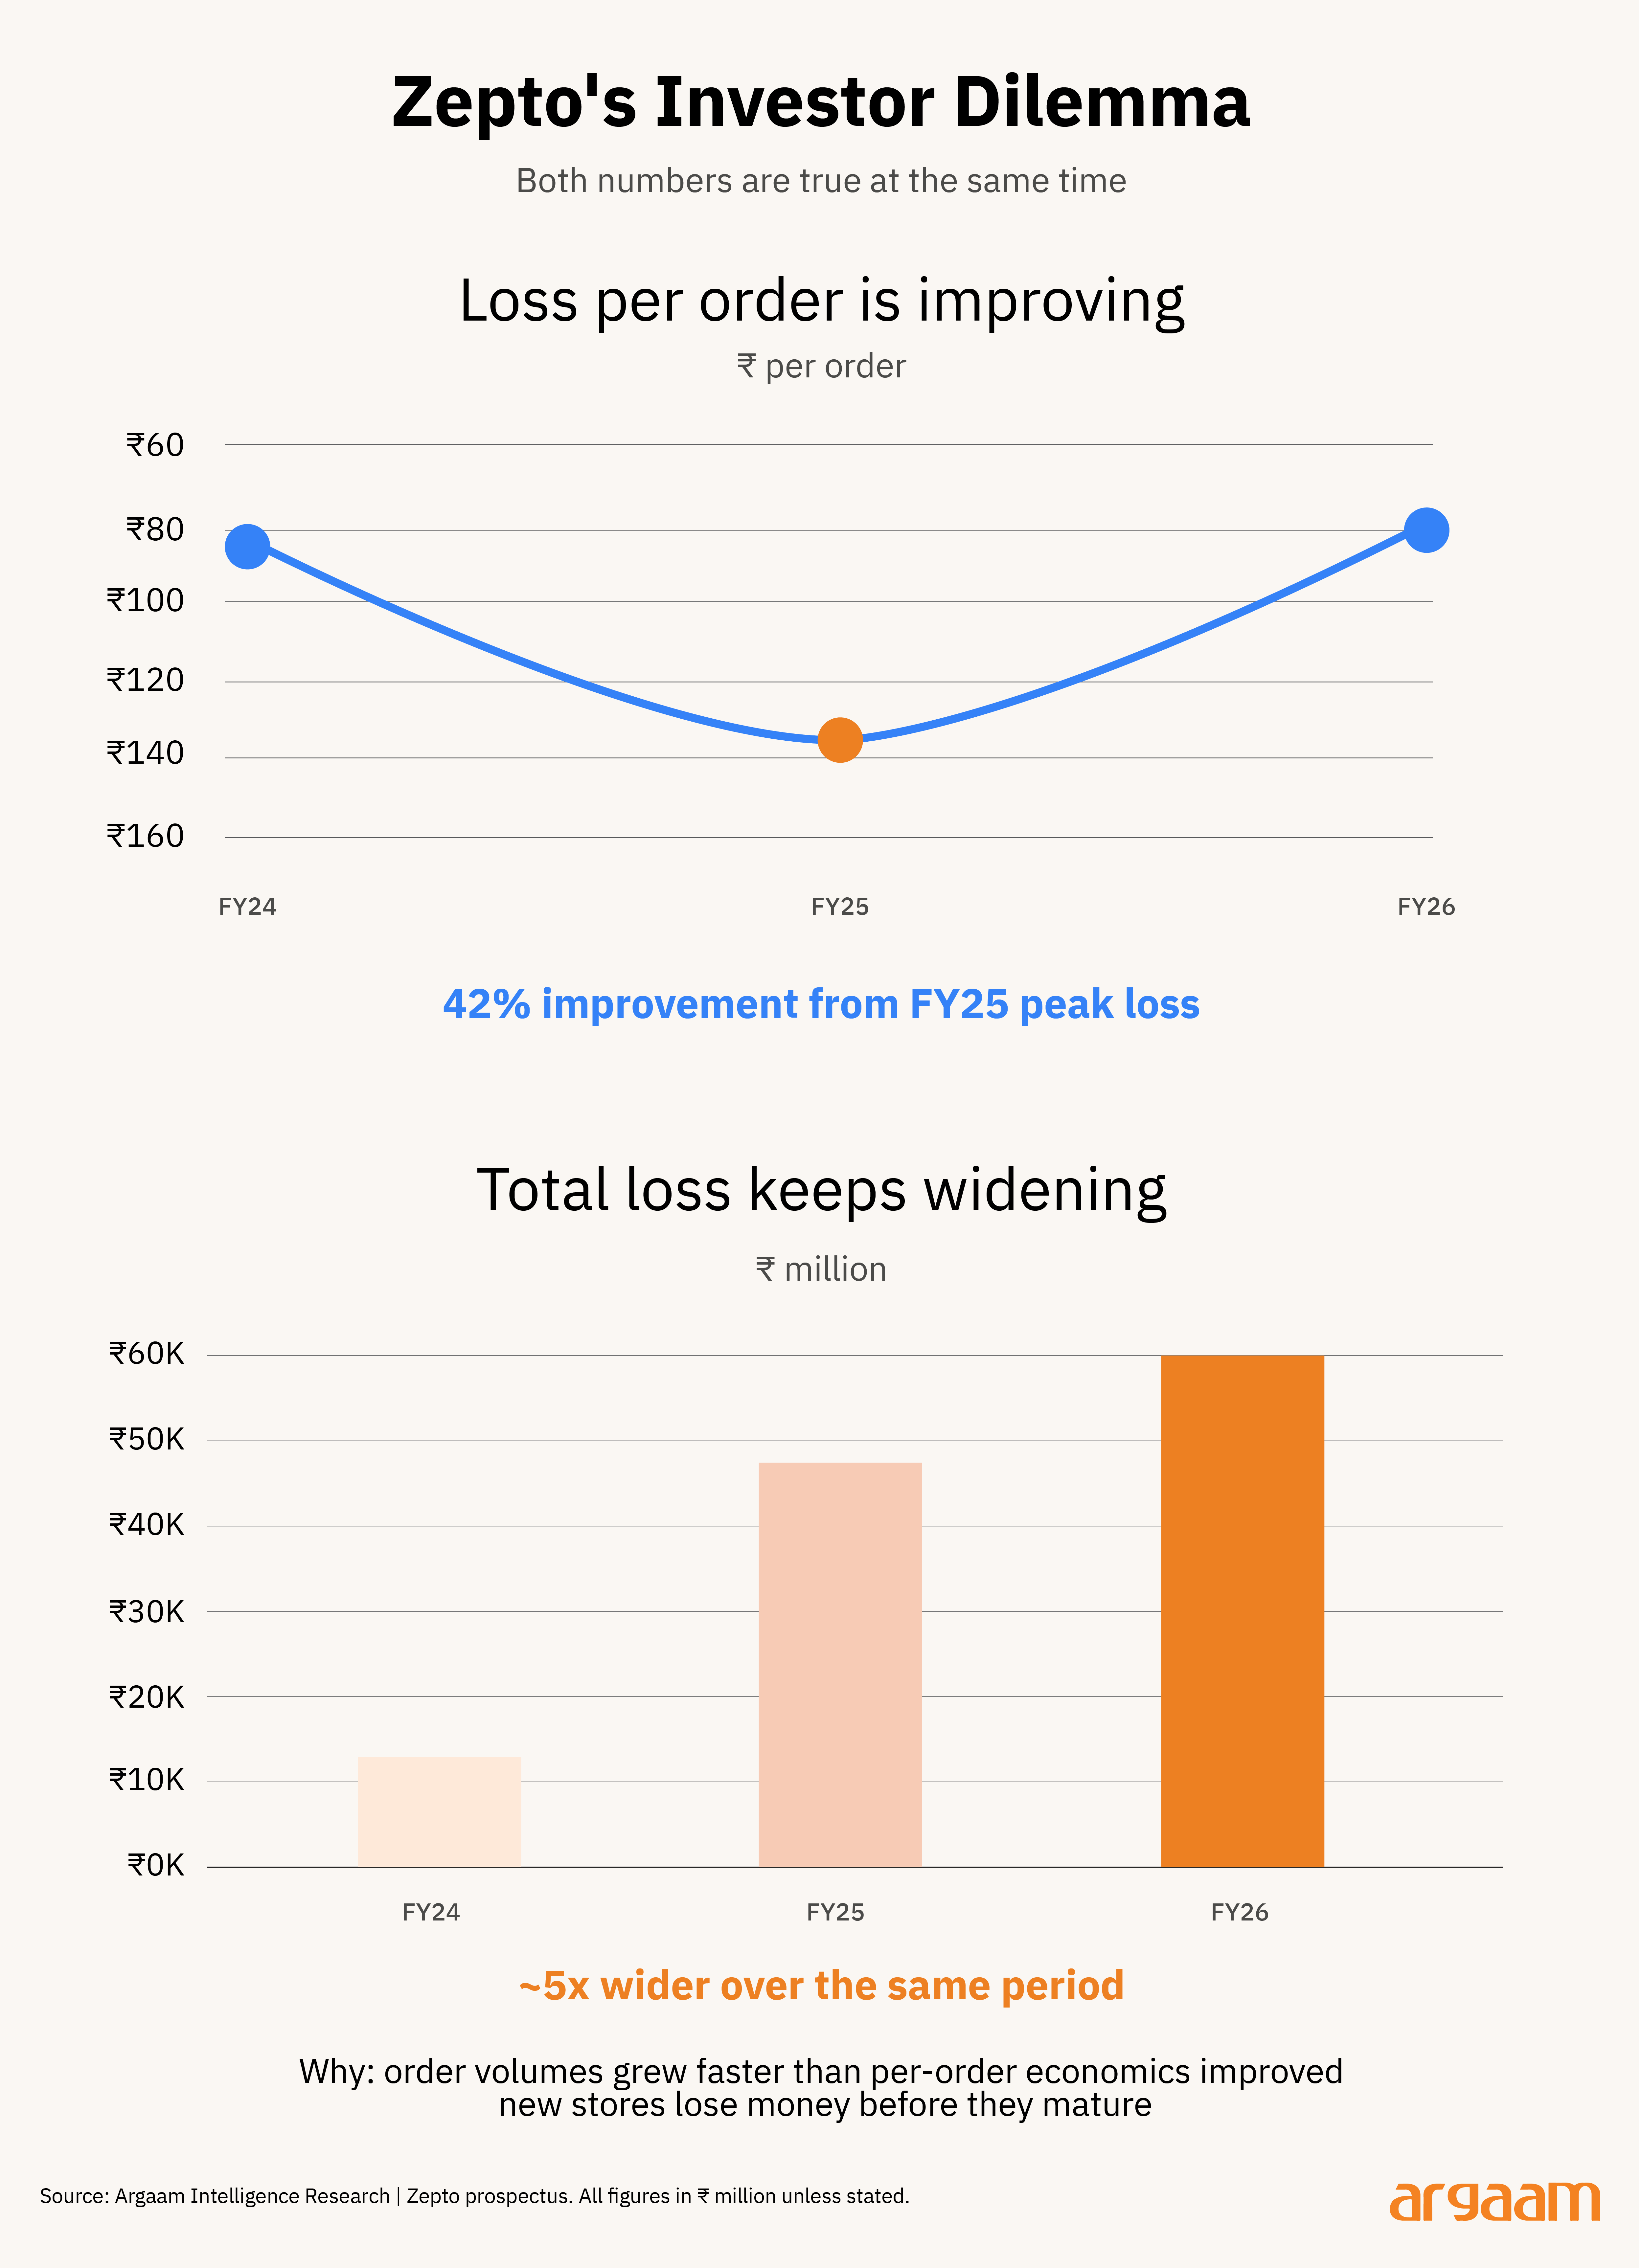
But the prospectus' own cohort data tells a more specific story than the repeat-rate figure alone. Annual Transacting Users fell from 49.54 million in Q3 FY26 to 47.97 million in Q4 FY26, the first disclosed sequential decline, and Zepto's disclosed quarterly cohort retention table shows why.
Comparing each cohort's retention one quarter after first order: FY24-FY25 cohorts retained between 49% and 60% of new users at that point. Every cohort acquired in FY26 has come in below that range, 43.2%, 47.2%, and 47.0% for Q1, Q2, and Q3, respectively.
Three consecutive quarters of new users churning faster than any prior year's cohort did, at the same stage in their lifecycle.
◎ Note: India's financial year runs from April 1 to March 31 — not January to December like the calendar year. So Zepto's FY26 means the year running from April 1, 2025 to March 31, 2026.
Zepto offers no explanation for this pattern in the prospectus. Our own read: it's more likely tied to the company's rapid push into smaller tier-2 and tier-3 cities, where users are newer to the platform and delivery infrastructure is less mature. That's different from a weakening of the core product in its established markets, though the disclosed data can't confirm which explanation is right.
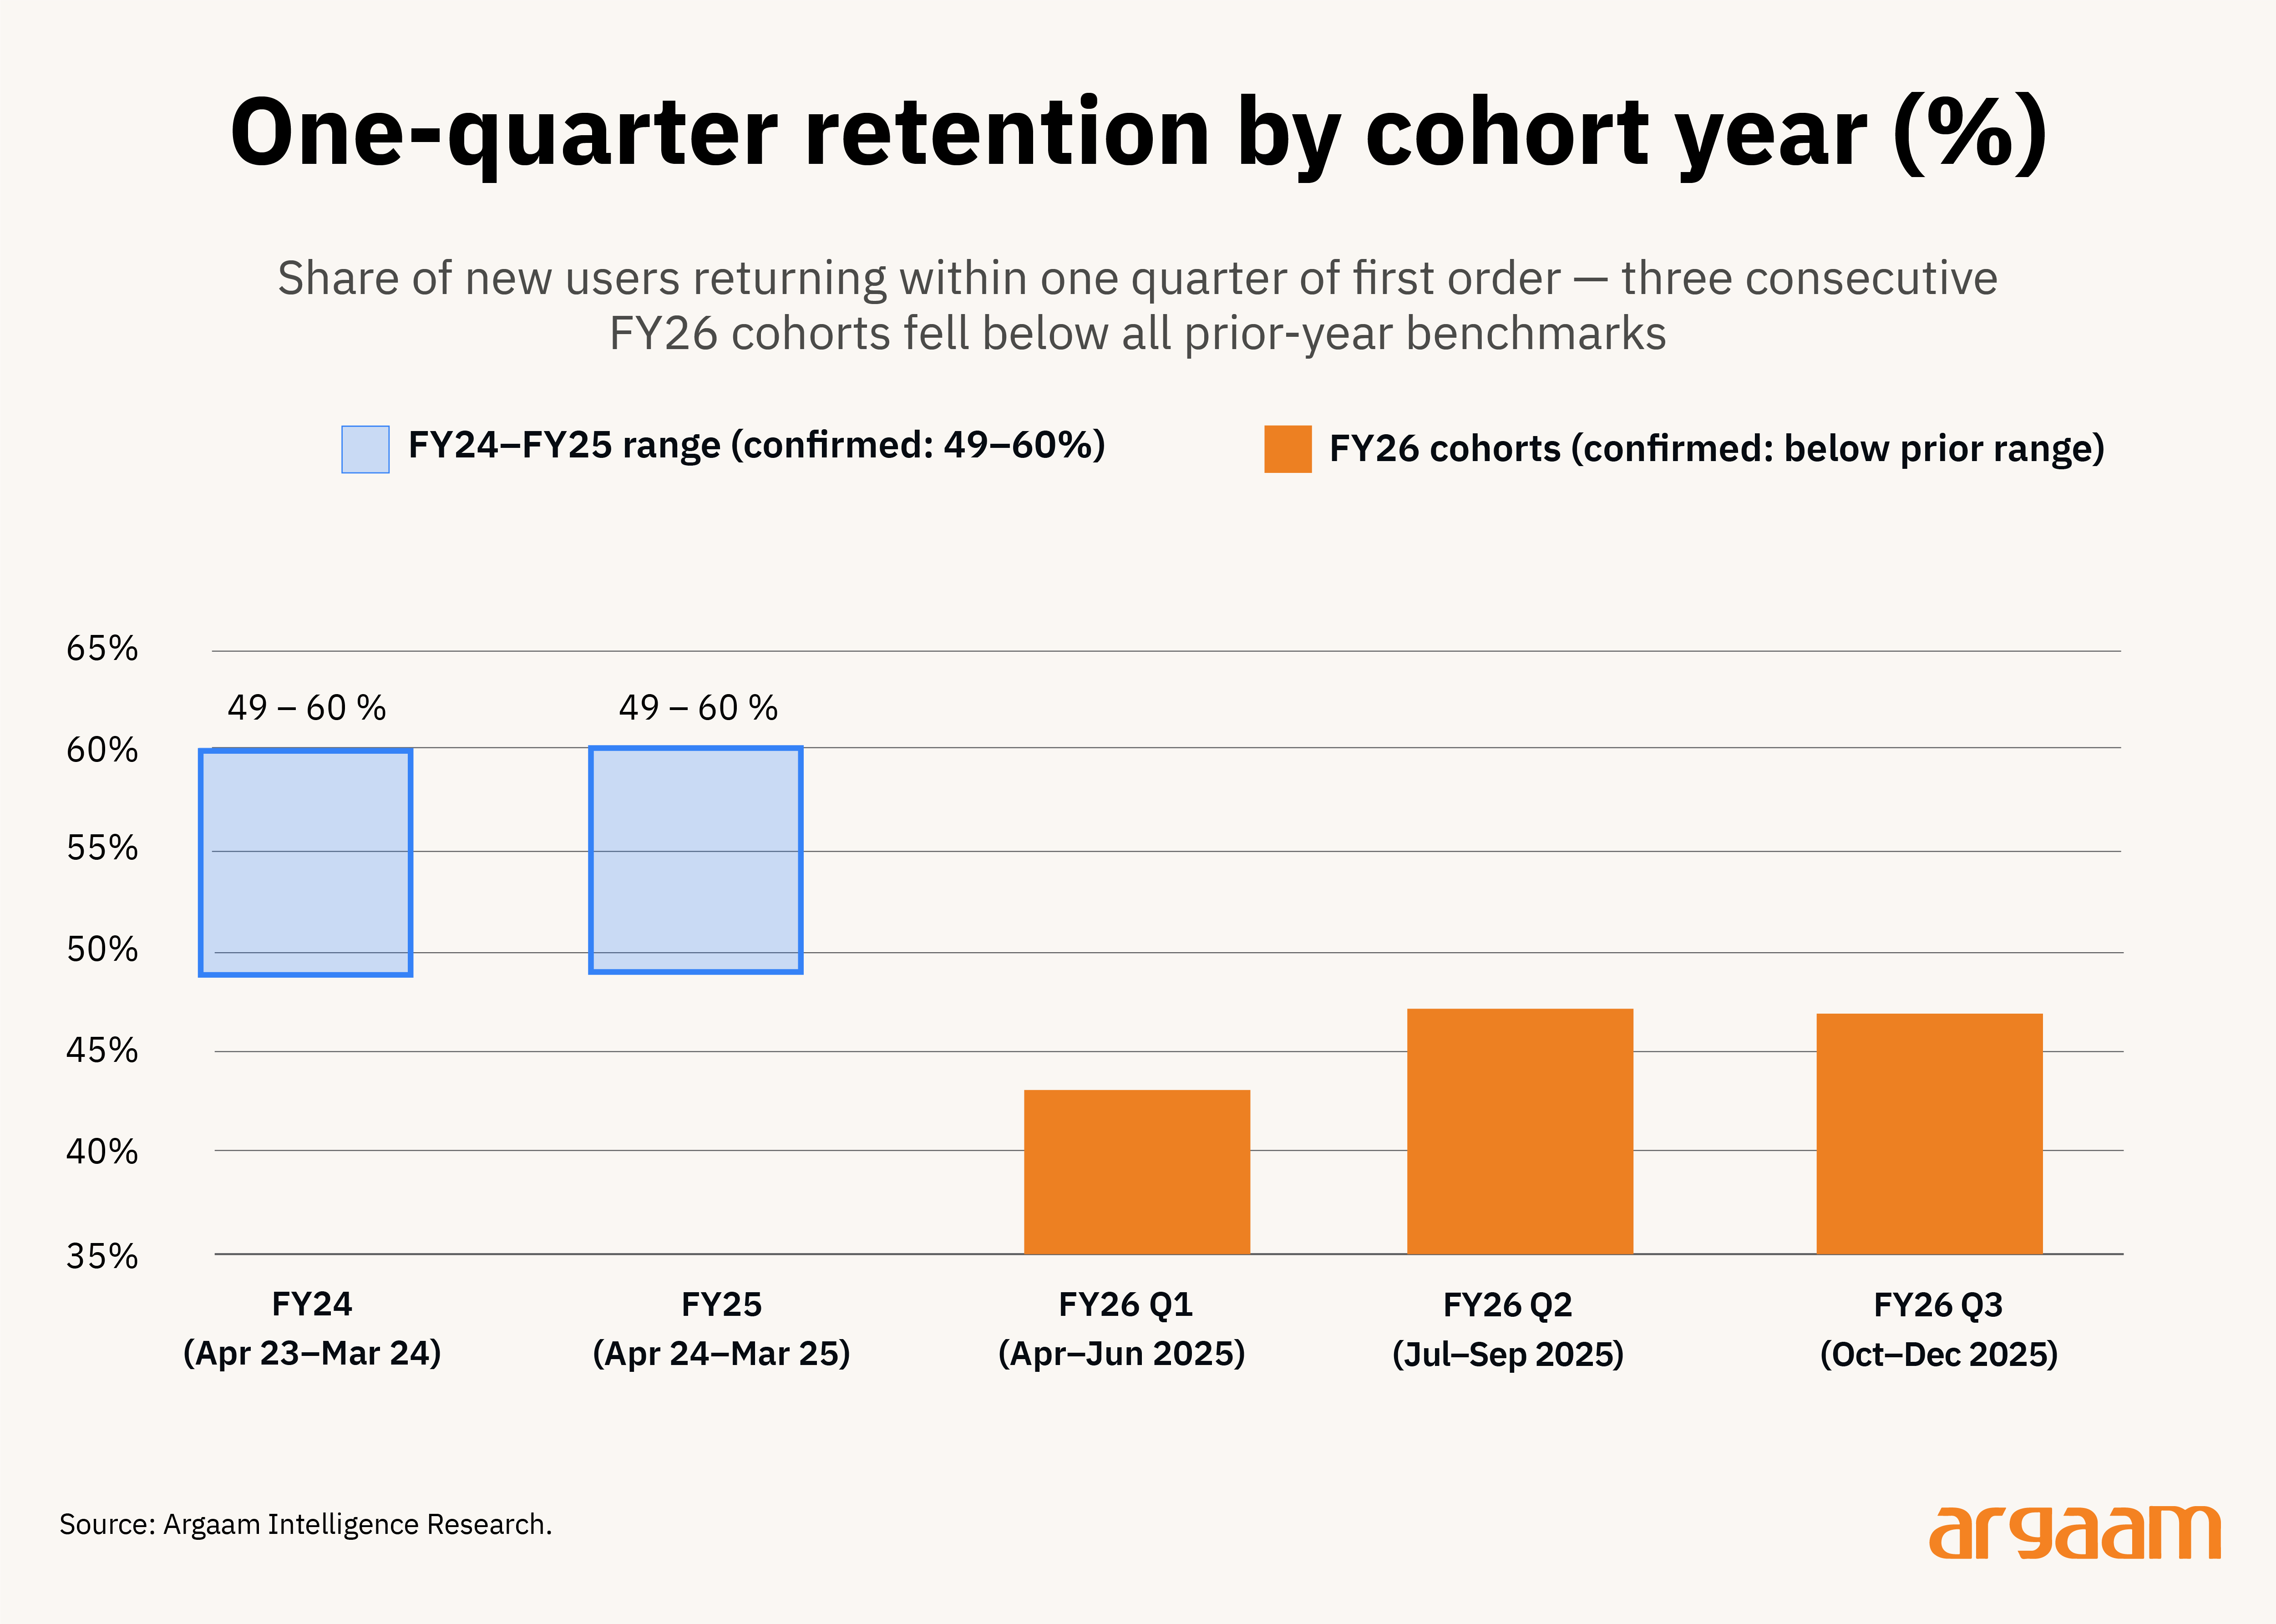
Note on Chart: India financial year: April 1 – March 31. FY26 = Apr 2025 – Mar 2026. FY24–FY25 bars show confirmed range midpoints (54.5%); exact cohort-level figures not individually disclosed in prospectus. FY26 Q1–Q3 figures are confirmed disclosure.

Advertising: the margin lever compounding on top of Zepto's growth
Retail media is an often-overlooked revenue stream, but it deserves more attention than it gets. Zepto's advertising revenue grew from ₹492 million in FY24 to ₹16,357 million in FY26, a 33x increase and now represents ~7% of revenue.
Unlike grocery sales, where Zepto pays the wholesale cost of goods, advertising carries no cost of goods behind it i.e it is close to pure margin. At roughly ₹25 per order, it is a meaningful contributor to per-order improvement. Excluding it, the EBITDA-loss trajectory would look materially worse.
There are limited peers disclosing advertising revenue as a separate line item in financials. Instacart's ad revenue sits nearer 28% of revenue, but that figure is inflated relative to Zepto's by its net-revenue reporting model (commissions and fees, not gross order value).
The bigger point: a successful dark store isn't just a q-commerce platform; it's a foundation other, higher-margin businesses can be built on top of, and advertising is one of the clearest examples so far.

Zepto is an outlier: most dark store operators own and operate their own stores
The franchise model has been evolving as the sector matures. Franchising made sense as a fast, capital-light way to grab territory early, but as operators shift focus from expansion speed to profitability and operational control, that calculus is changing.
Zepto sits on the earlier side of that curve with ~40% of its stores being COFO (company-owned, franchise-operated).
The prospectus doesn’t disclose separate unit economics for company-run versus franchise stores, meaning every per-order metric is a blended average across two structurally different models.
For a pre-IPO company with a constrained balance sheet, this strategy makes sense as franchise partners fund store buildout and staffing, letting Zepto scale density faster than its own capital would allow.
Zepto's blended model has few clean precedents globally: operators elsewhere have mostly gone fully company-operated (Gopuff, Flink, Gorillas) or franchised-infrastructure/company-controlled hybrid (Getir).
Getir is the closest analogue, and its franchise approach hasn't obviously solved profitability either — the company still went through steep cost-cutting before eventually merging with Gorillas. Whether Zepto's COFO mix is transitional or permanent comes down to two things: economics good enough to justify buying the stores out and they have the capital to do it.

Al-Othaim's Widening Gap: A Peer Comparison
Grocery retail is under pressure, and it's showing up across every peer
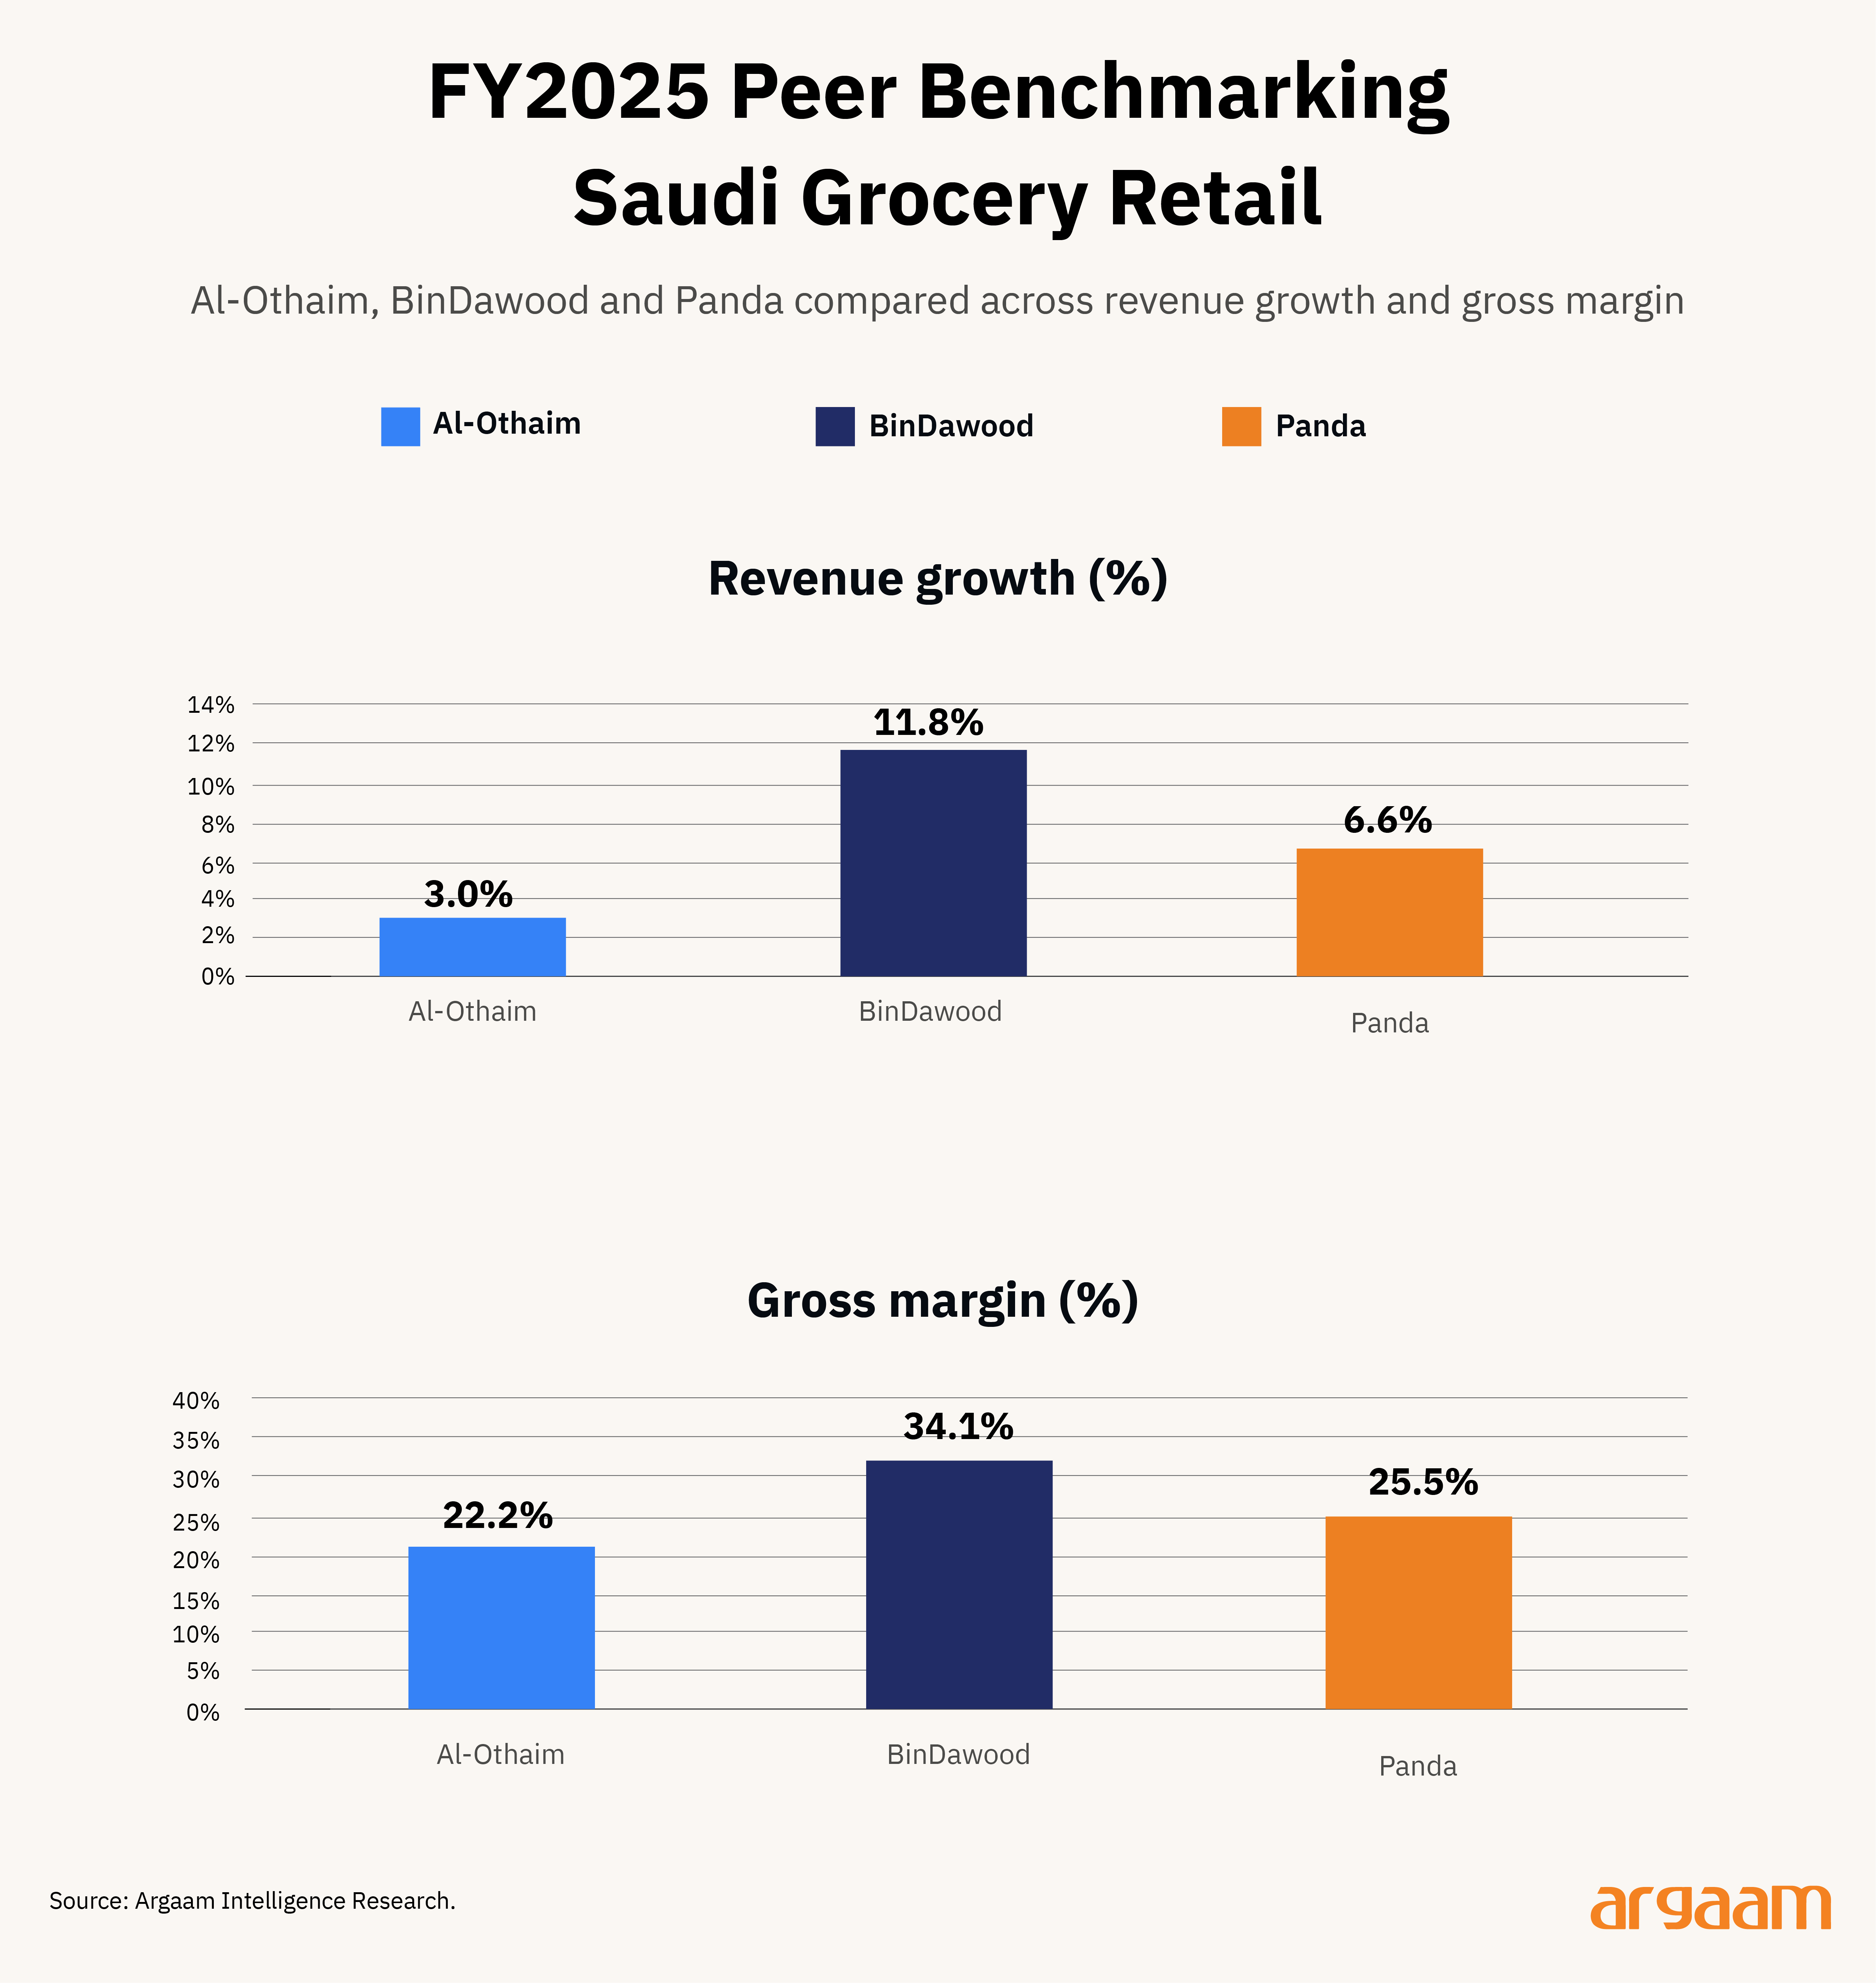
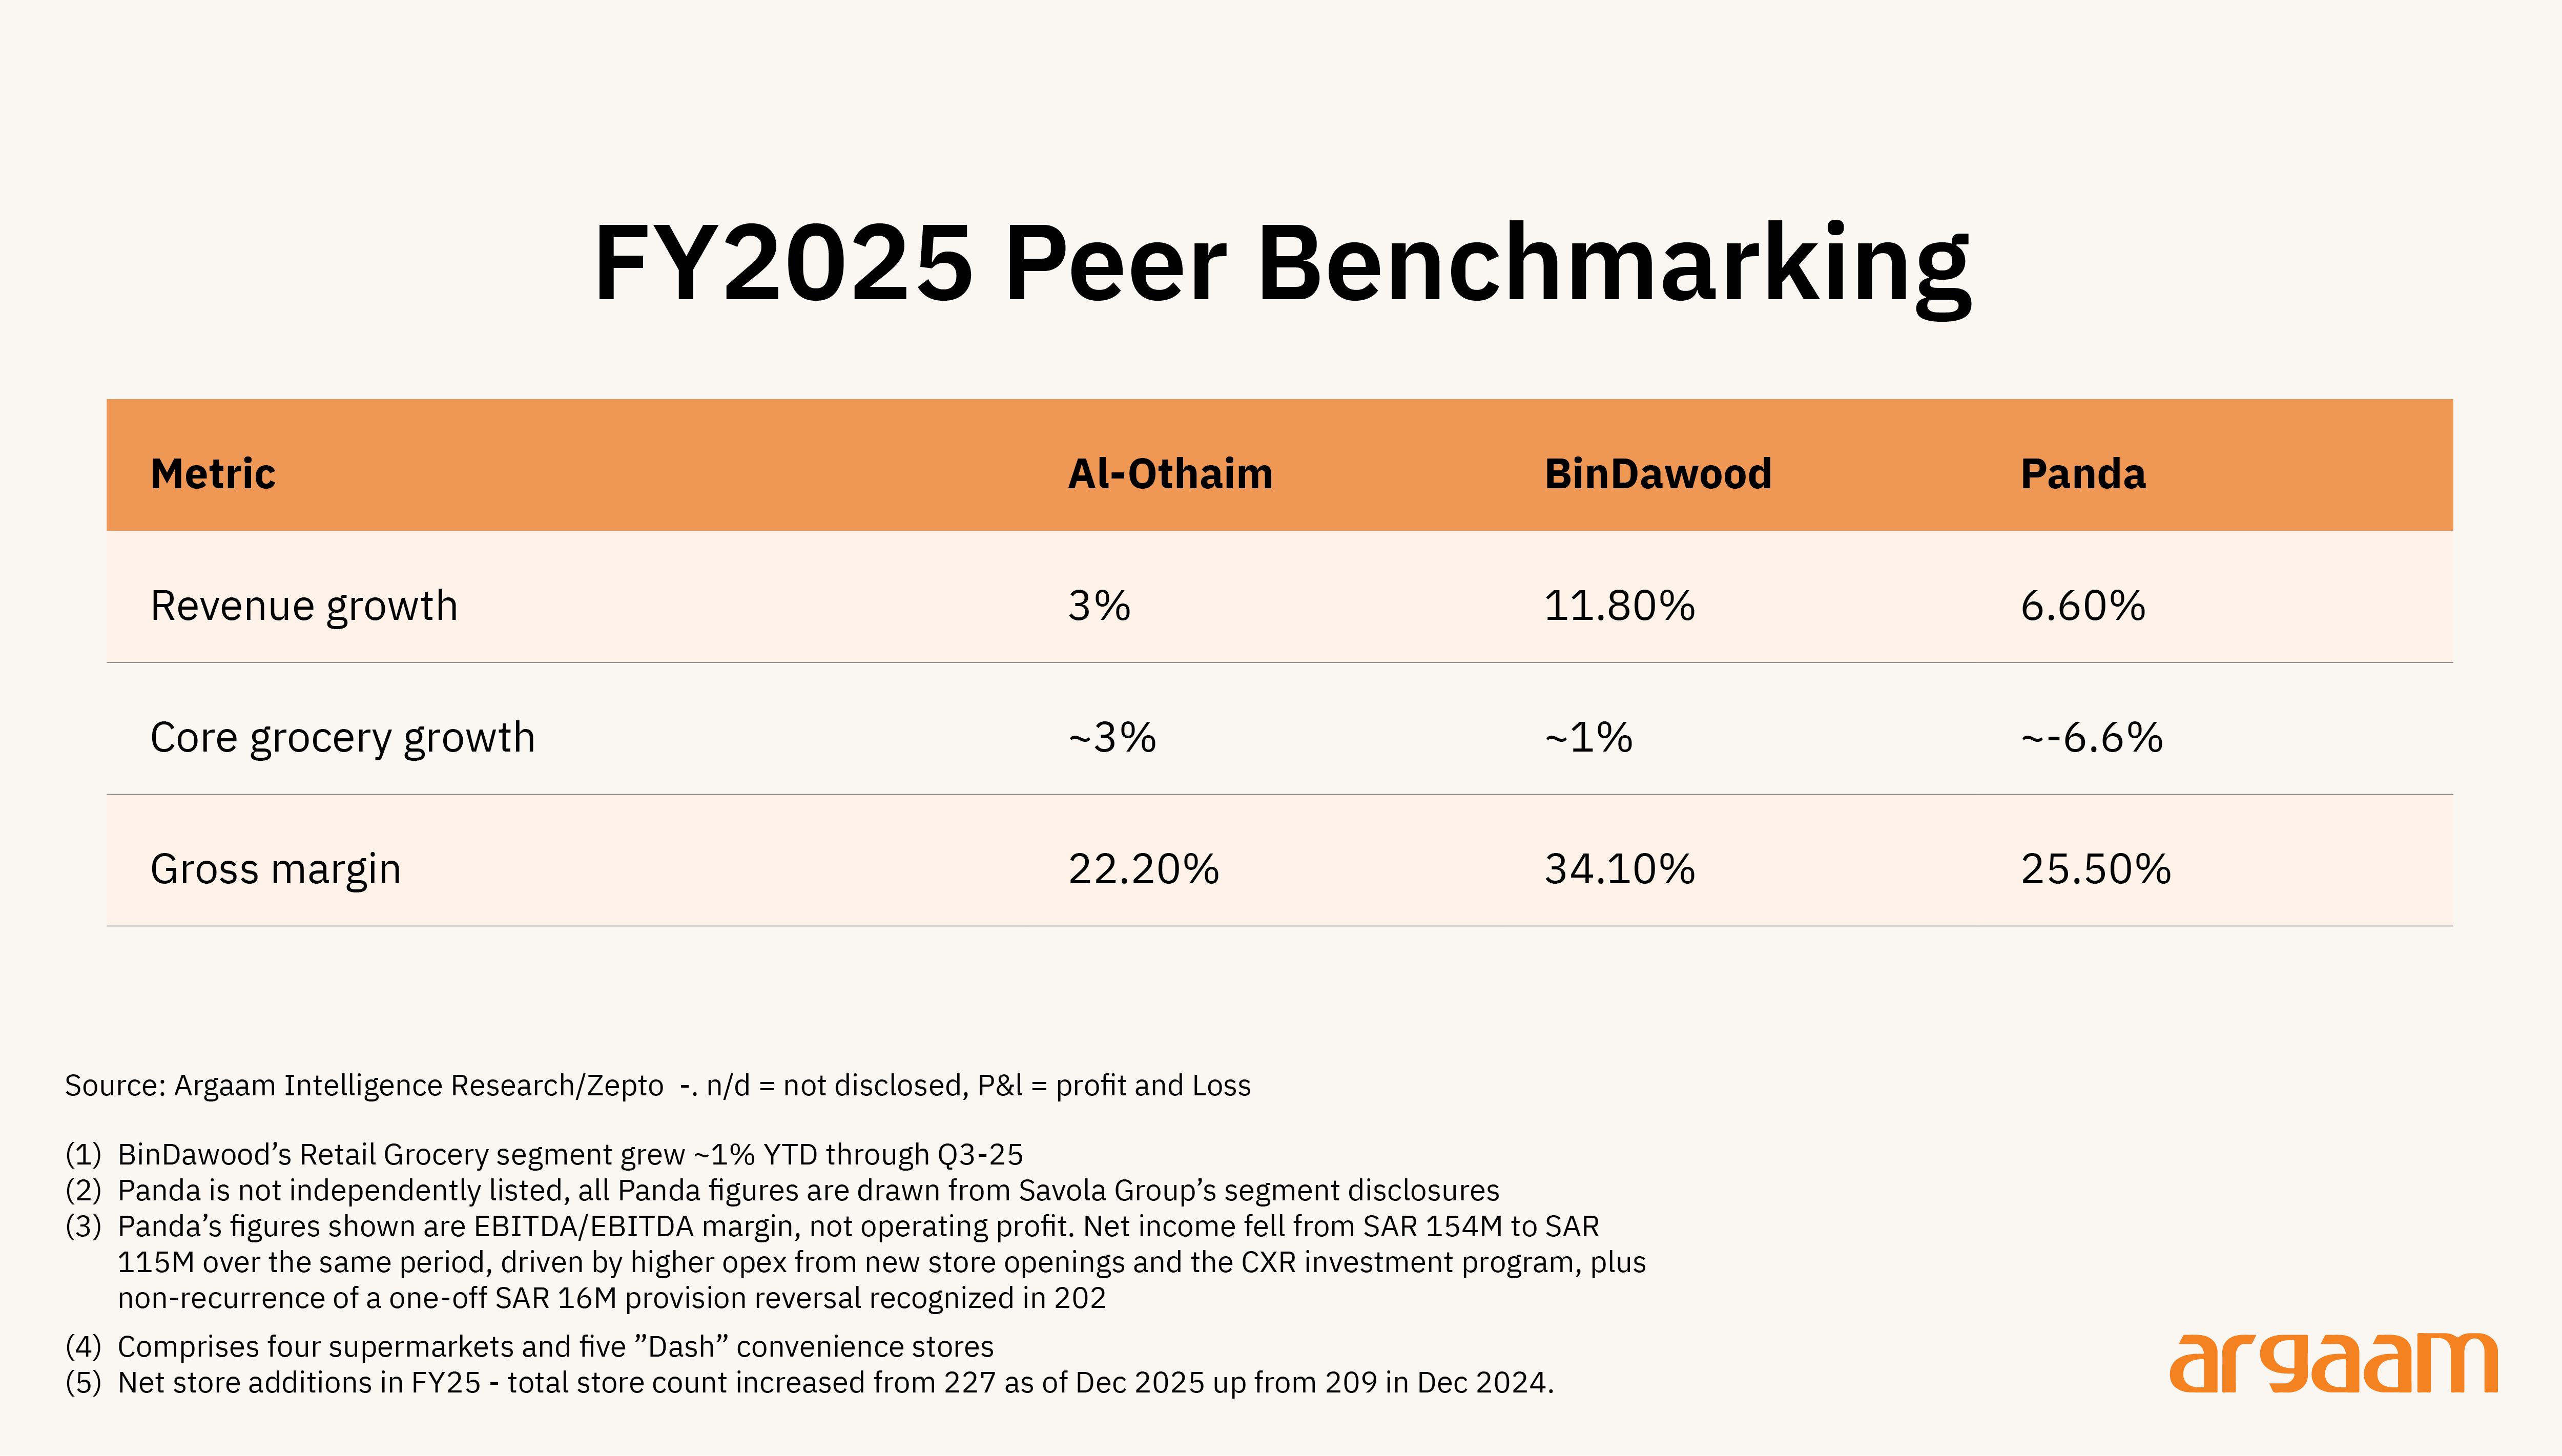
Al-Othaim's business is overwhelmingly grocery-led: supermarkets, hypermarkets, and corner stores make up a large majority of its revenue, and that core grew ~3% in FY2025. BinDawood's core Retail Grocery segment, stripped of its pharma and distribution acquisitions, grew only ~1% year-to-date through Q3 2025.
Even Panda, whose retail segment is still growing at 6.6%, cites rising competitive intensity and margin pressure.
This isn't a single-cause story, the pressure on physical grocery footprints is coming from multiple directions at once: continued competition from other well-capitalised brick-and-mortar retailers (Lulu, Carrefour, Spinneys) alongside the newer, faster-growing threat from quick commerce.
Grocery retail is in a tough spot to absorb that pressure because margins start out thin. A retailer in a higher-margin category (e.g. pharma) has more room to defend share without cutting into profit, and a retailer that stays purely grocery without building that kind of margin-cushioning diversification is mostly left with one lever: price. That's the position Al-Othaim is in.

The real divergence is strategic direction
BinDawood and Panda are both executing on a clear strategy, and the numbers and management commentary reflect that. BinDawood is diversifying away from grocery through acquisitions e.g. Zahrat (pharmacy, acquired February 2025) and Jumeirah Trading Company, a wholesale distribution business acquired in late 2024.
Together these have driven a stronger revenue growth trajectory (~12%) and higher operating profit (+7.2%). Panda, on the other hand, is investing heavily in its existing stores through the Customer Experience Revival program and new openings, weighing on near-term profitability but positioning the company, according to management, to capture greater market share now and operate a more efficient, scalable platform once the investment cycle matures.
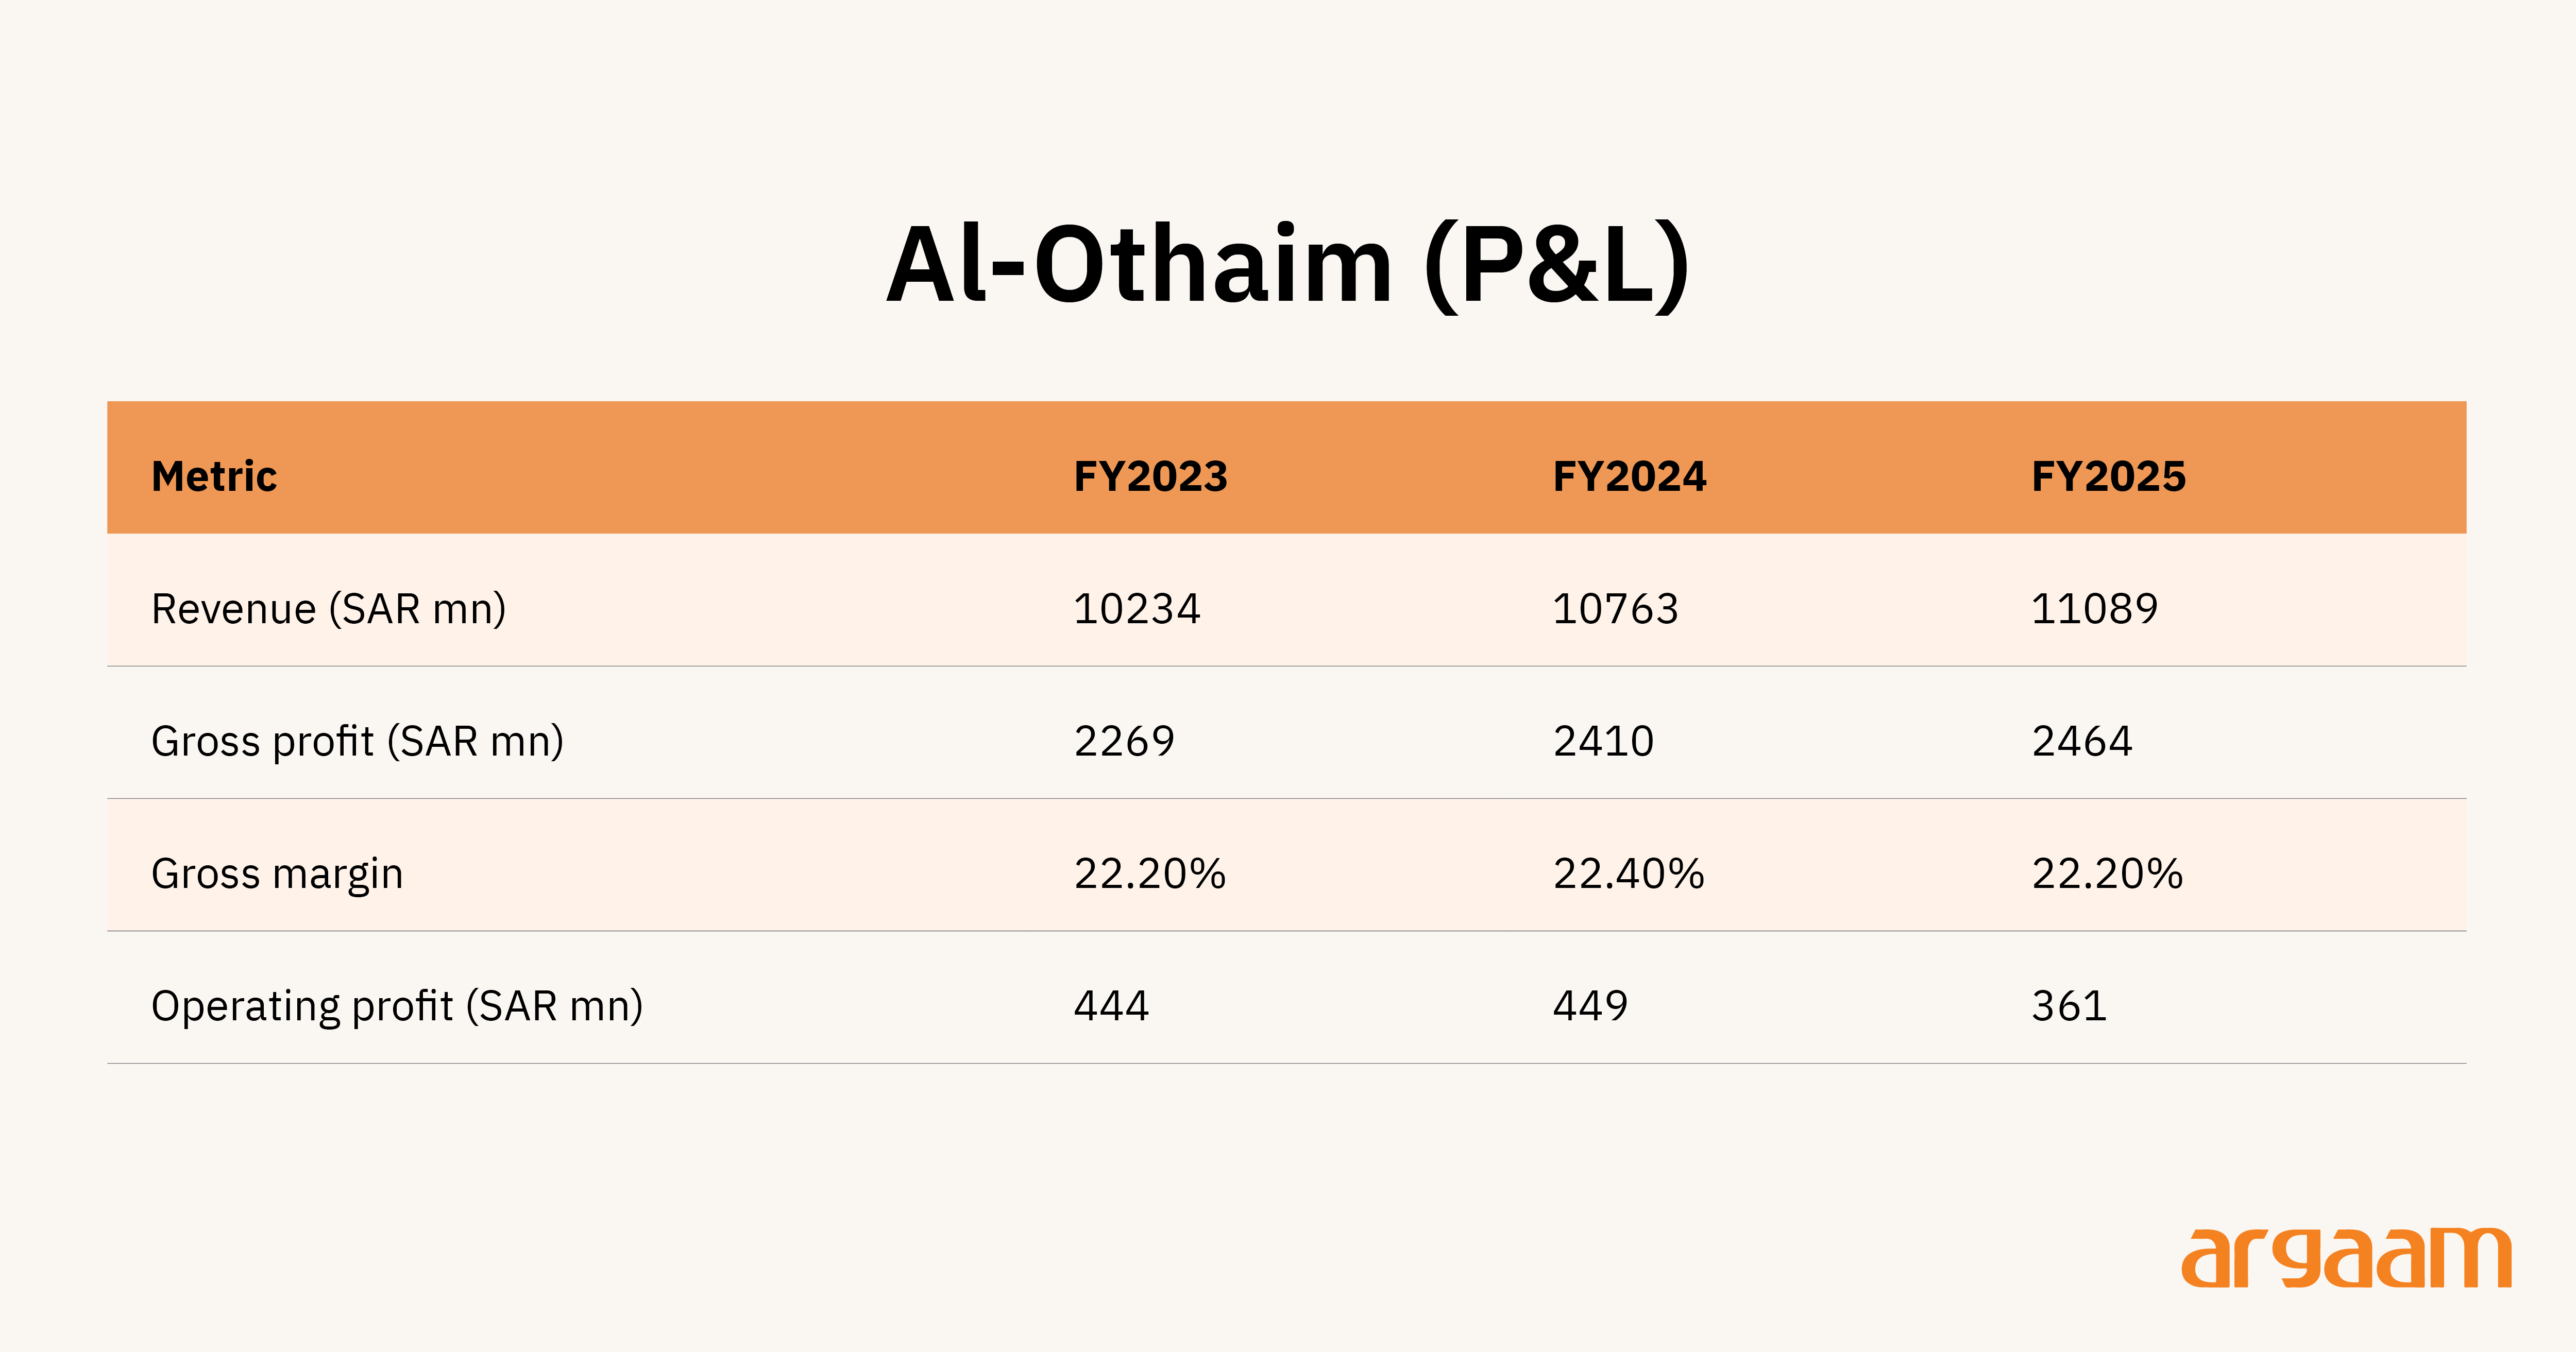
Al-Othaim's strategy has been somewhat defensive rather than offensive: promotional discounting to defend market share and absorbing rising costs from new-branch lease financing.
Its own diversification is real; rental income from the Dammam mall lease and improved results from Mueen (labor/staffing services company) have both cushioned recent results; neither can be replicated at scale.
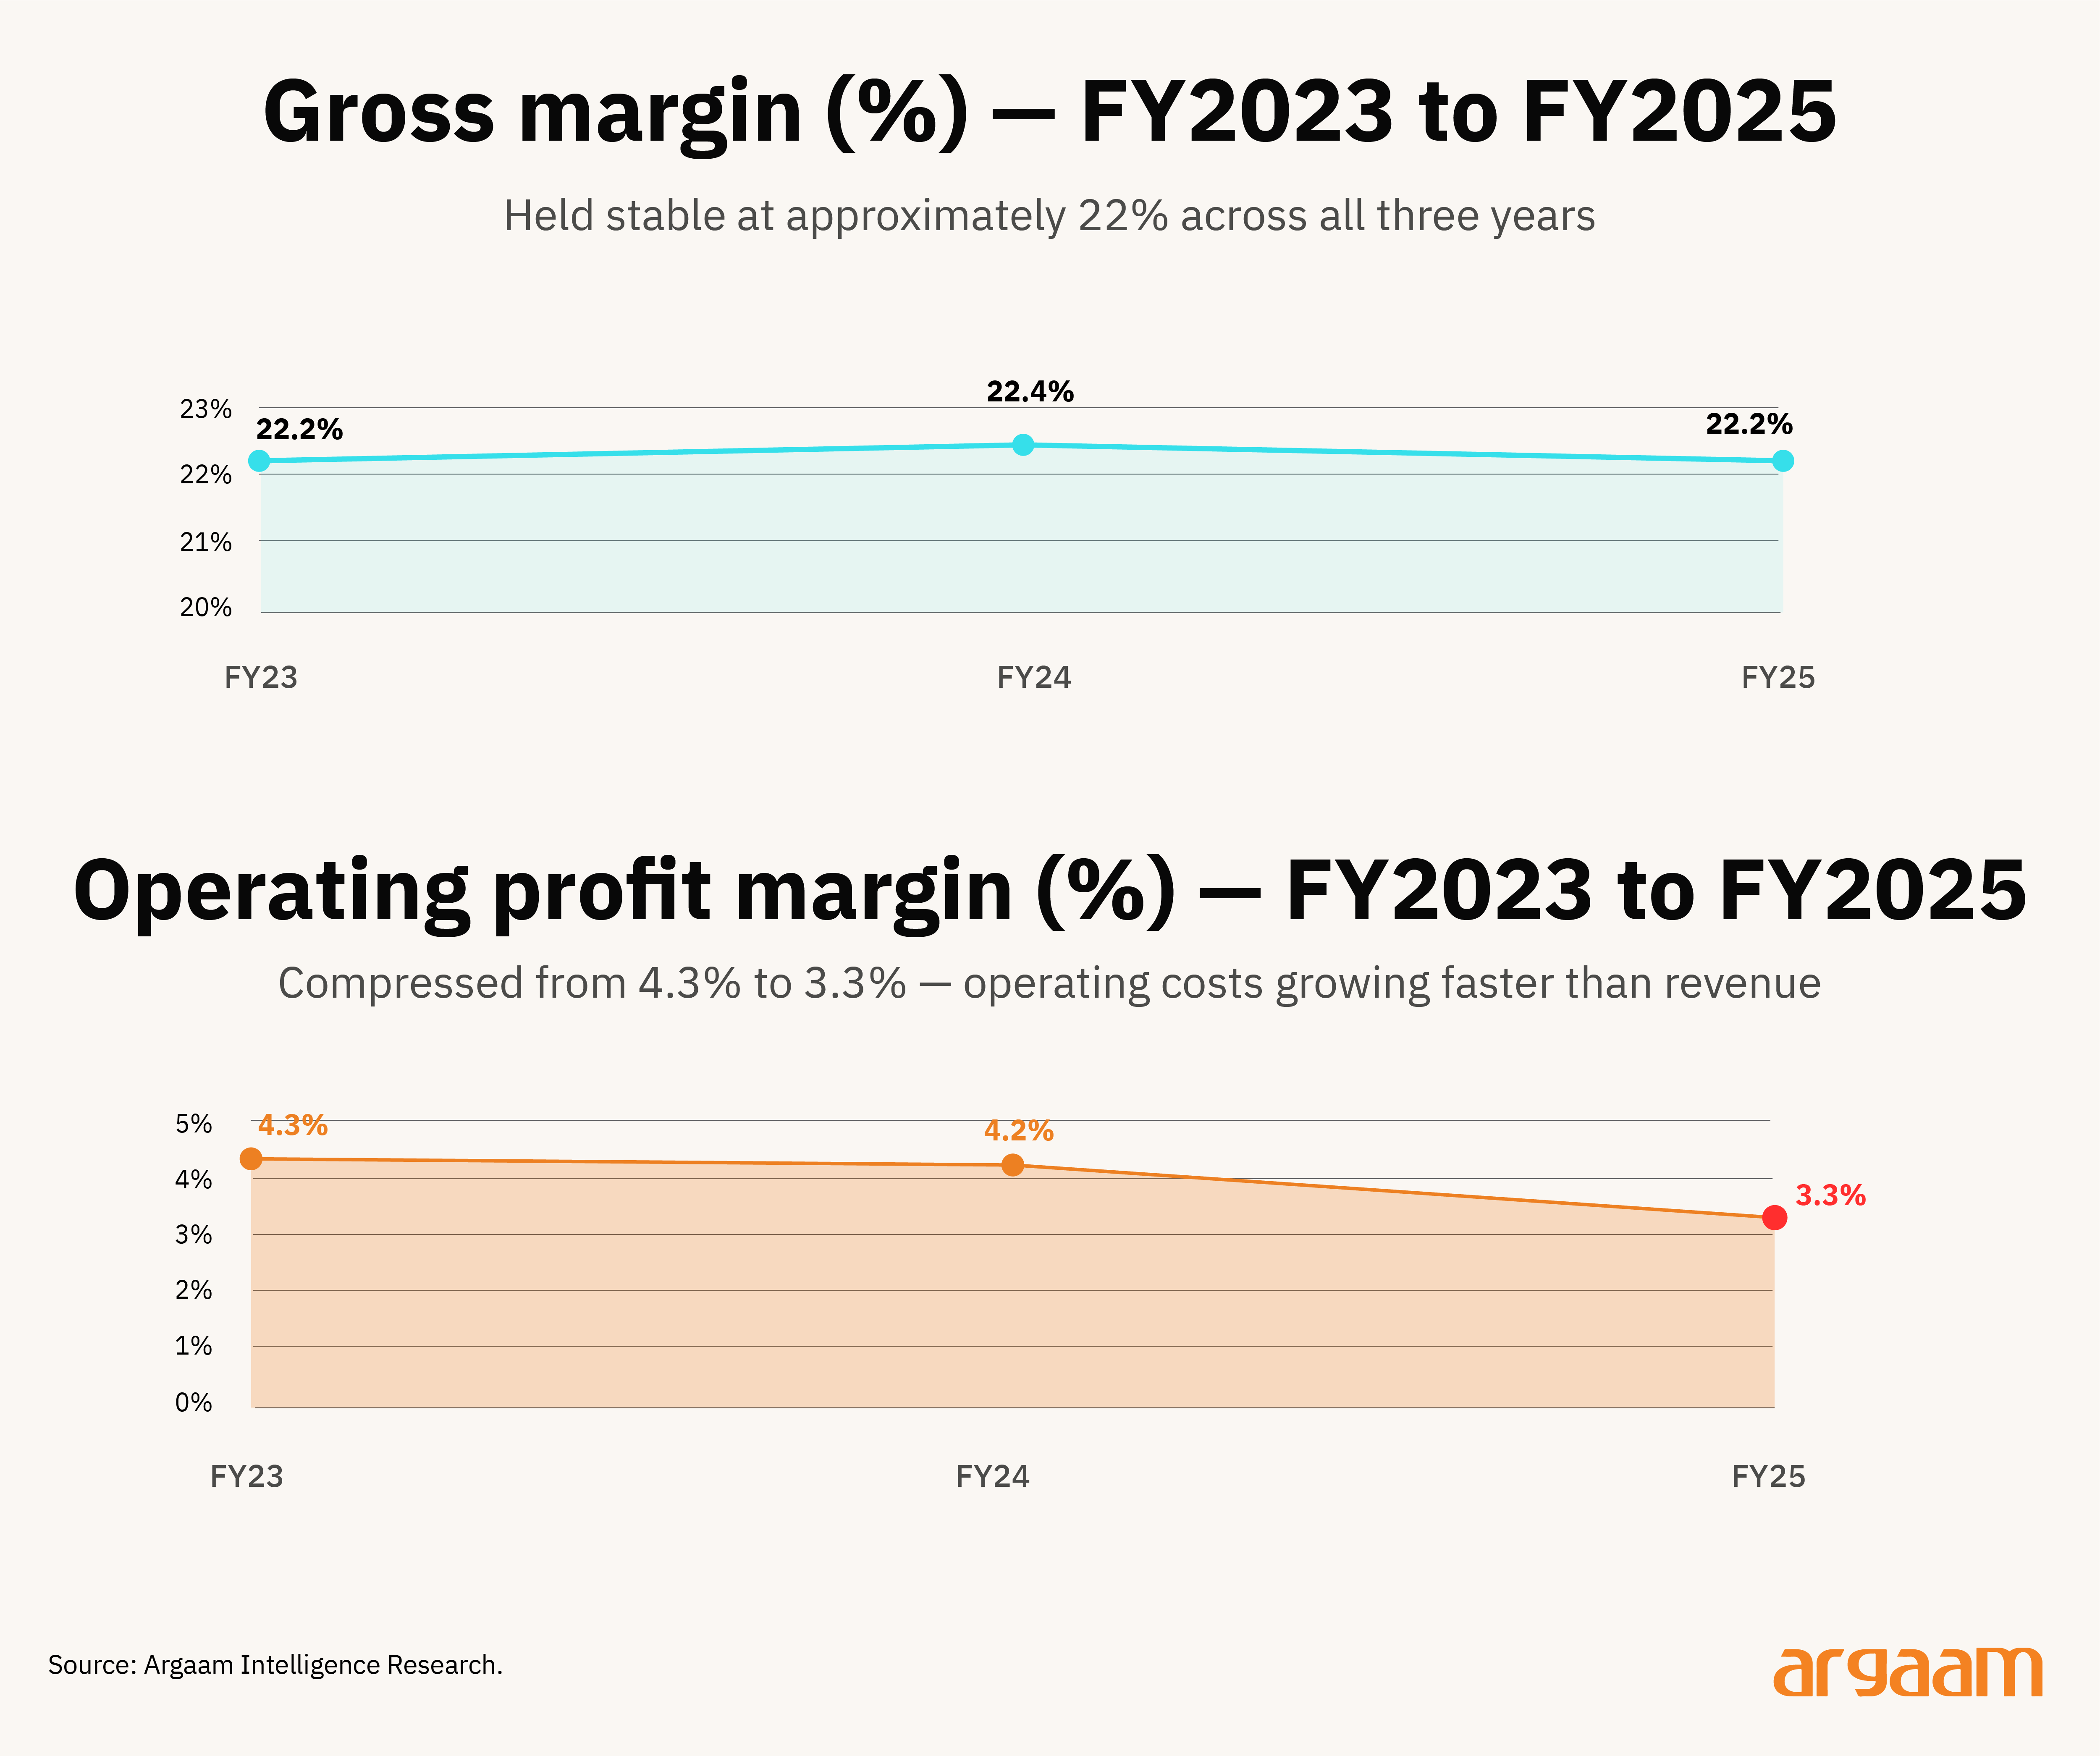
Real estate income is tied to a handful of fixed lease assets, not a rollout that compounds, and Othaim Express, its one true retail move, is still grocery, not a new margin category. The numbers reflect that gap: revenue grew just 3% for the year, the slowest of the three, while operating profit fell 19.5%.

Store growth has stalled, the clearest sign the growth engine itself has stopped
Store expansion was Al-Othaim's own most direct growth lever before FY2025. The company opened 57 stores and closed 4 in FY2023, then opened 50 and closed 1 in FY2024 a steady ~50-store-a-year pace.
That contrasts sharply with FY2025. While the full FY2025 quarterly breakdown isn't available, Q2 and Q4 openings aren't disclosed, the two confirmed quarters tell a consistent story.
Al-Othaim opened 5 new branches in Q1 2025 and just 1 net store in Q3 2025 (2 opened, 1 closed per independent reporting), both well short of the ~50-store-a-year pace the company maintained in FY2023 and FY2024.
The incremental benefit of opening new branches was now limited given higher opex, consistent with a company that can no longer afford the pace it set for itself.
In contrast, both peers kept building, at a pace consistent with their own recent history. BinDawood added nine new stores for the full year (four supermarkets, five smaller-format Dash locations), roughly in line with its historical annual pace on a much smaller base than Al-Othaim's. Panda opened 20 new stores in Saudi Arabia in FY2025, which its COO described as "maintaining pace" with the prior year's 16 openings.

Al-Othaim is moving digital through partners
Al-Othaim struck two grocery-delivery partnerships in FY2025, in addition to an existing arrangement with HungerStation. In June, it partnered with AliExpress to offer same-day and hourly grocery delivery in Riyadh, drawing on its store network as the supply base.
In October, it launched a similar arrangement with Amazon Fresh, with Amazon handling logistics and AI-driven inventory matching while Al-Othaim supplies the products. Neither company has disclosed the commercial terms of either deal, but the structure alone means Amazon and AliExpress own the app, the customer relationship, and the delivery infrastructure, while Al-Othaim's role is limited to supplying inventory.
Panda's digital strategy is different. Its app is powered by Ocado, the UK-based online-grocery technology provider, but the app itself, and the customer relationship behind it, belong to Panda.
That difference shows up clearly in the numbers: Panda's online revenue grew roughly 3x year-on-year. We found no evidence Al-Othaim operates a comparable owned delivery platform, and no performance data has been published for any of its partnerships.
◆ Concluding thoughts◆
The quick-commerce sector sits at the intersection of two industries under real strain. Grocery retail runs on thin margins, and its highest-frequency occasion is now the one most exposed to competition.
Quick commerce has drawn heavy investor scrutiny, following well-publicized failures and downsizing across Europe. Neither side has really found its footing yet, which is exactly why the overlap between them is worth examining further.
Grocery retail survives because it sells necessities. But the single-format store probably doesn't stay unified. None of the three retailers here are seeing absolute revenue decline.
The dividing line isn't physical versus digital — it's diversification. BinDawood bought into adjacent, higher-margin categories; Panda reinvested directly and built an owned digital platform. Al-Othaim has stayed defensive, and its shrinking operating margin shows what that costs over time.
The GCC has no shortage of well-funded grocery retailers, which is really the point — capital alone hasn't been what separates the winners. The pressure on all of them is coming from every direction now, including quick commerce, which doesn't need to beat a hypermarket on scale or price. It just needs to win the small, frequent trip a customer used to make on the way home.
Quick commerce isn't obviously winning this fight economically either, as our analysis has shown, and the balance is harder than it looks. Zepto's own numbers show growth can be pushed hard, but it tends to strain either profitability or retention somewhere else. Growth here isn't linear, which is exactly why the operators who navigate it well need to stay nimble.
What’s real, though, is that capital markets haven't closed in emerging markets the way they did in Europe. IPOs and exits are still happening, even as the market reprices them hard once growth slows and margins stay unproven.
The same diversification instinct shows up here too. Some of the prize sits in higher-margin categories, but the bigger opportunity is the layers built on top of commerce itself: retail media, and the data a direct customer relationship generates. Zepto's own advertising platform is a clear example of what owning that layer looks like.
The question worth carrying forward, in either industry, isn't who's growing fastest. It's who has room to evolve their business model, and who can show their unit economics hold up once competition intensifies, growth slows, and the promotions stop. Few operators manage both at once, and that gap is exactly what drives consolidation.