Saudi Arabia's low-cost aviation market has crossed a structural threshold. For years it was effectively a one-carrier story — flynas setting the pace on domestic and short-haul routes while Saudia served the full-service end of the market. That architecture has changed.
Flyadeal has scaled into a position that makes the budget segment genuinely competitive in a way it was not before — two carriers of meaningful size, operating alongside Saudia's full-service network, each large enough to discipline the other's pricing and route decisions.
That structural shift matters more than the individual airline numbers suggest. In aviation, margin formation is not just a function of how efficiently each carrier manages its own costs.
It is shaped by the competitive architecture of the market itself.
A second scaled low-cost carrier raises the competitive floor — fares are tested more frequently, route discipline tightens, and the segment becomes structurally relevant to the broader Saudi aviation story in a way that a single dominant budget carrier never could be.
The question that follows is not which carrier is larger. It is whether the market is now structured in a way that makes ancillary revenue and destination monetisation the primary battleground — because on fare alone, the margin available to either carrier is already under pressure.

Re-Routing the Market
Recent industry analysis indicates that low cost carriers now account for 39% of Saudi aviation traffic, compared with 60% in some of the most mature low cost markets.
LCC penetration in Saudi Arabia rose from about 20% in 2015 to 39% in 2023, surpassing the GCC average of 31% over the same period.
According to domestic market estimates from Al Jazira Capital, Saudi Arabia's premium and budget air corridors underwent a major reshuffle between 2021 and 2024:
◉ Saudia (Premium): Dropped from a dominant 65% market share down to 52%.
◉ flyadeal (Budget): Climbed from 19% to become the second-largest domestic carrier at 24%.
◉ flynas (Budget): Expanded its presence from 17% up to 23%.
The budget operators then captured 11% of the domestic market directly from the state flagship carrier in just three years, splitting those gains almost equally between them.
Note: flynas carried 15.8 million passengers in 2025, up 7% y/y, with available seat kilometres rising 11% to 28.1 billion across a fleet of 71 aircraft, 156 routes and 80 destinations in 38 countries.
Its low-cost segment generated SAR 7.09 billion in revenue in 2025, thereby accounting for just over 90% of group revenue, showing that the low-cost platform isn’t only large in traffic terms but economically central to the business model.
flyadeal has also reached a scale where it must be treated as a genuine second pole in the Saudi low-cost airline market.
The carrier flew 10.7 million passengers in 2025, up 33%, while seat capacity increased 21%, route count rose to 159, destinations to 43, and fleet size to 44 Airbus A320 aircraft.
Nearly 90% on-time performance across the year suggests that this growth is being supported by increasingly robust operating execution, rather than by simple addition of fleet alone.
Within that shared trend, however, the two low-cost carriers remain differently weighted by route type: flynas operates a 33% domestic/67% international ASK mix, with domestic passengers still accounting for 52% of its traffic in H1 2025, while flyadeal is far more domestically focused, with about 68% of its ASK in the local market.
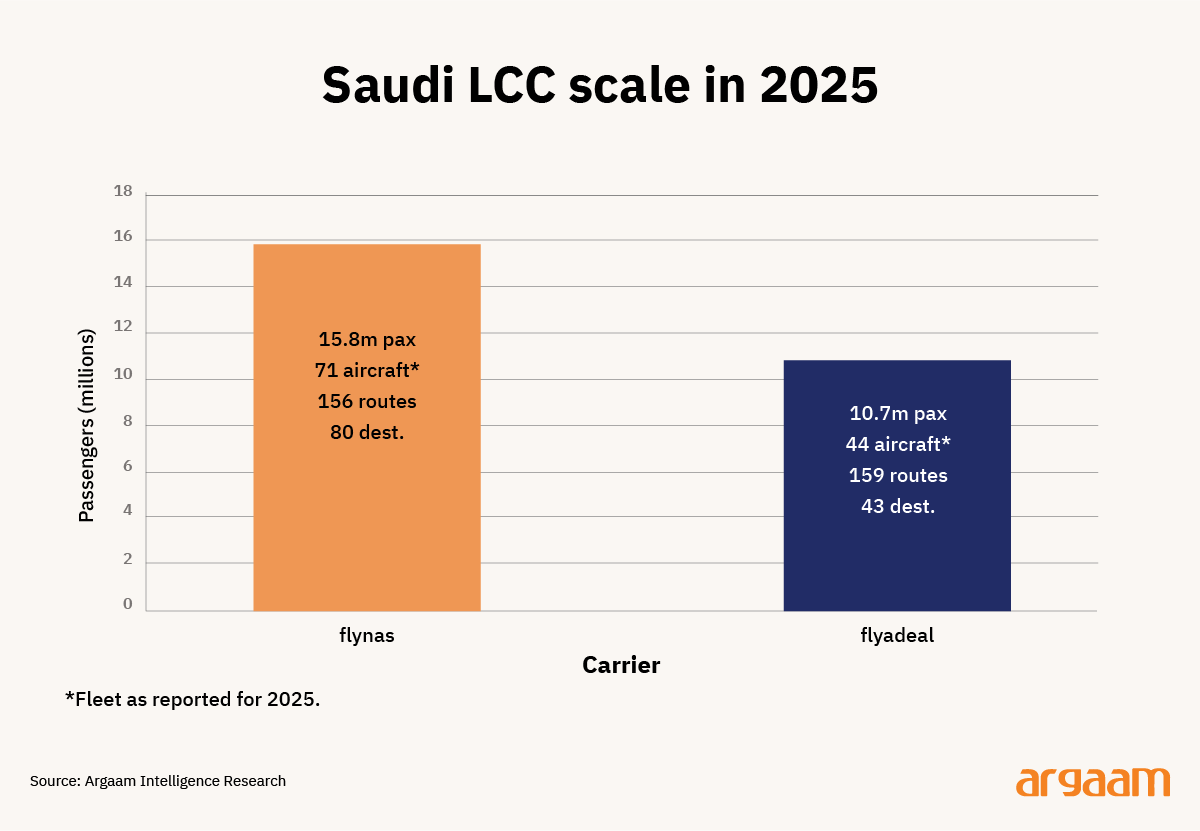
Saudi Arabia Redefined GCC Low-Cost Aviation
Taken together, these data show that low-cost carriers are not only enlarging their aggregate share, but are systematically displacing full-service capacity on domestic routes and building more international depth.
This divergence is also what sets Saudi Arabia’s low cost carriers apart regionally: peers such as flydubai, Air Arabia and Jazeera rely entirely on international ASKs, with no domestic component, reflecting the small home markets they are based in.
In contrast, flynas and flyadeal can draw on a domestic market large enough to sustain genuine local networks alongside international growth — meaning Saudi Arabia’s low-cost carriers are building a dual engine model that most GCC peers structurally cannot replicate.
The Margin Gap Still Sits in Revenue Quality
The sector’s key unresolved issue centres around whether they can monetise each passenger at a level that narrows the gap with the world’s most mature low-cost operators.
In a fully developed low-cost model, profitability is shaped by the interaction of three things: seat density, unit cost efficiency and non-ticket revenue depth. Saudi Arabia has progressed materially on the first two, and the third remains less visible and appears less developed.
That’s why Argaam Intelligence decided to dedicate the second analysis in this in-depth edition to looking beyond traditional baggage and seat selection fees to explore how the airline seat is being used as a strategic anchor to capture and monetise a traveller's entire downstream journey.
flynas’ 2025 financials show that the business is commercially viable at scale. Revenue rose to SAR 7.84 billion, adjusted EBITDA increased 15% to SAR 2.5 billion, and adjusted net profit rose 28% to SAR 556 million.
For every kilometre of seat capacity flynas operated, it earned 24.9 halalas in revenue — down from 26.4 halalas in 2024. But its adjusted cost per seat kilometre also fell, from 24.9 to 23.3 halalas. Because costs fell faster than revenue, the gap between the two widened slightly — from 1.5 to 1.6 halalas. A small improvement, but it means flynas defended its unit margin through cost discipline rather than revenue growth.
A 1.6 halala spread between revenue and cost per seat kilometre is profitable — but it leaves almost no room for error. When margins are this thin, the economics of every additional seat added to the network matter immediately.
Capacity that fills at the right yield improves the spread. Capacity that fills at a discount, or does not fill at all, erodes it. At this level of tightness, what the passenger spends beyond the fare is not a supplementary revenue stream. It is where the real margin lives.
When flynas adds a new route, increases the frequency of an existing route, or brings a larger aircraft into service, it is adding capacity. More seats are now available for passengers to buy across more flights and more destinations.
The harder question is whether the additional seats can be filled at fares that cover the cost of flying them and still leave a positive spread.
When the spread between revenue per seat kilometre and cost per seat kilometre is only 1.6 halalas — as flynas's numbers show — the airline has very little cushion.
Mature low-cost carriers defend margins not only by lowering cost per seat kilometre, but by extracting more value per passenger through baggage, seating, onboard sales, loyalty, partnerships, and broader travel retail monetisation.
By contrast, flyadeal’s public reporting focuses mainly on passengers, capacity growth, network breadth and operational performance, with far less granular disclosure on unit revenue and unit cost metrics.
Flyadeal does not disclose enough financial detail to calculate its revenue or cost per seat kilometre precisely from public data. What is visible — its growing route network, passenger volumes, and market share — points to a carrier that is becoming structurally significant in Saudi low-cost aviation, even if its unit economics remain opaque.
Flynas filled 83.2% of its available seats in 2025, down from 85.6% in 2024 (load factor — the share of seats occupied by paying passengers). The decline is not alarming on its own. What it signals is that as capacity grows, filling seats at the right price matters more than simply filling them.
At these levels, the margin increasingly depends on what the passenger spends beyond the fare.
Flynas earned more from international routes than domestic in 2025 — SAR 4.41 billion versus SAR 2.63 billion.
International growth improves revenue but brings more exposure to bilateral agreements, competition, and varying airport costs. Domestic routes remain the network's foundation. The margin challenge is not simply growing internationally but improving the revenue quality across a network where economics differ significantly by market.

The Bilateral Constraint That European Low-Cost Carriers Never Had to Solve
Saudi low-cost carriers operate in a more regulated environment than their European peers. Ryanair and easyJet built their models in a market where aircraft moved freely across borders, competition was unrestricted, and route entry and exit were fast.
Saudi carriers face bilateral constraints, regulatory frameworks, and airport economics that limit the same flexibility. The European benchmark is instructive — not directly transferable.
Saudi Arabia's international aviation operates within bilateral agreements — government-to-government arrangements that determine which routes can be flown, at what frequency, and with what capacity. Commercial demand alone does not open a new international route. Access has to be negotiated first.
Flynas's 2025 network additions — Russia, Kosovo, Uganda, and Djibouti — illustrate this directly. Each new market required bilateral clearance before a single seat could be sold. That constraint is absent in Europe, where carriers like Ryanair enter, intensify, or exit routes based almost entirely on commercial logic.
For Saudi carriers, international growth is as much a function of diplomatic sequencing as commercial demand — and that shapes everything from network planning timelines to the pace at which ancillary revenue can scale on routes that only become viable once access is secured and frequencies are built to sustainable levels.
Saudi carriers don’t yet match this frontier profile. flynas discloses total RASK and CASK but not a separate ancillary revenue line, and flyadeal doesn’t disclose RASK or CASK data.
Saudi low-cost carriers have built real commercial scale and positive unit margins. But ancillary revenue — the fees, bundles, loyalty products, and retail partnerships that generate roughly a third of unit revenue at carriers like Ryanair and easyJet — remains less developed. The core flying economics have matured. The monetisation layer has not caught up.
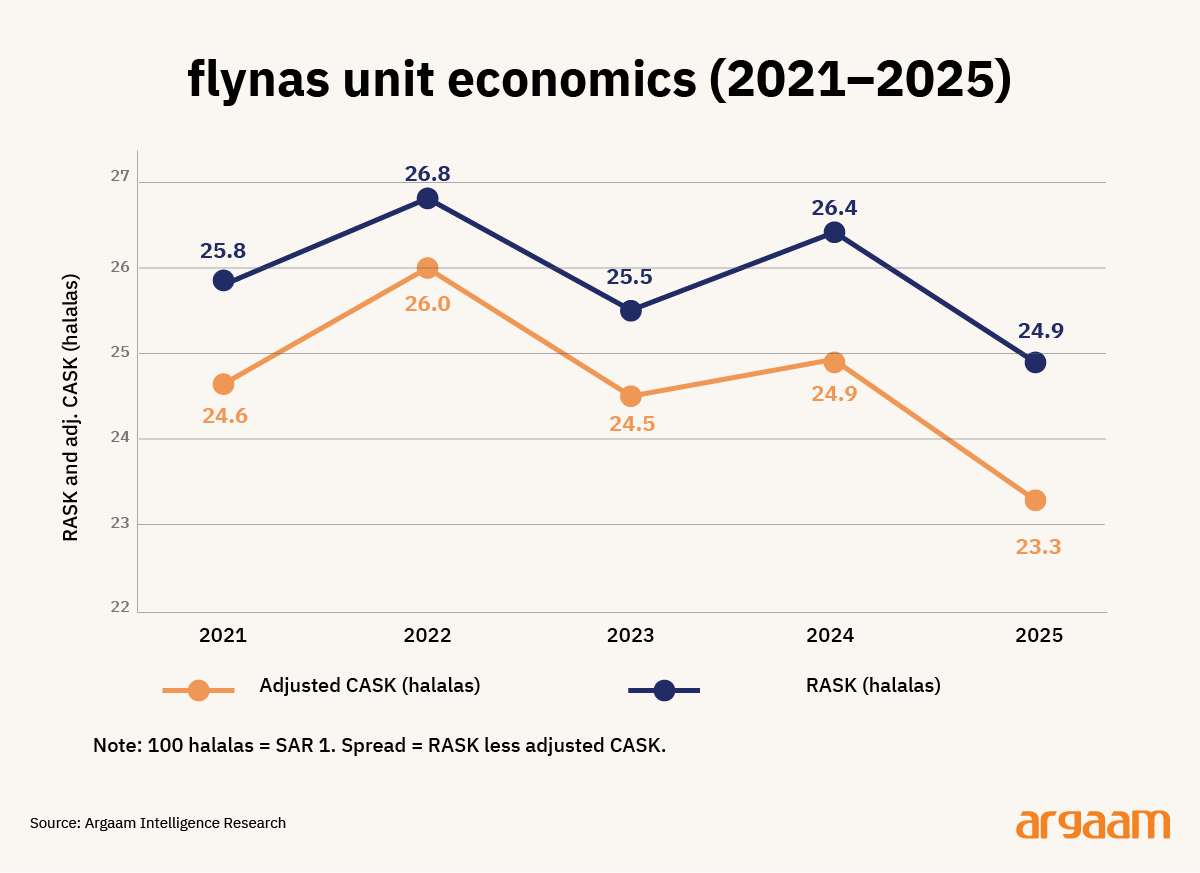
The chart tracks flynas's revenue and adjusted cost per available seat kilometre — in halalas — from 2021 to 2025. The gap between the two lines is the unit spread: wider means stronger margins, narrower means margin pressure.

The Fuel Price Flynas Pays Is Not the Same Fuel Price Ryanair Pays
Fuel costs add another structural distinction. Flynas flagged fuel and operating-cost volatility as a principal risk for 2026, even as fuel and handling charges declined slightly in 2025.
Gulf fuel pricing, supply arrangements and hedging practices differ from European deregulated markets — meaning unit-cost comparisons between Saudi and European carriers reflect market structure as much as carrier efficiency.
None of this makes Saudi Arabia unattractive. Growth is strong. But the path to margin maturity is structurally different — Saudi low-cost carriers operate within a national aviation strategy balancing connectivity, tourism, pilgrimage traffic, and infrastructure development simultaneously. That is a broader mission than pure cost minimisation.
A more competitive market
Saudi Arabia is adding more low-cost carriers. An Air Arabia-Nesma-KUN consortium is building a Dammam-based carrier targeting 57 international and 24 domestic routes by 2030.
A Medina-based airline focused on religious tourism is also planned, alongside a third carrier yet to be announced — all part of a broader Vision 2030 strategy to reach 150 million annual visitors.
More competition deepens market maturity but also sustains fare pressure. Unless ancillary revenue, route quality, and cost efficiency improve in parallel, additional carriers compress margins rather than expand them.

Scale Without Ancillary Depth: The IndiGo Warning
Against global benchmarks, the pattern is clear. easyJet’s ancillary RASK of 1.78 pence against total RASK of 5.71 pence implies that ancillary revenue alone represents roughly one third of unit revenue.
Ryanair’s FY2025 results show ancillary revenue per booked passenger of about EUR 23.6, also in the mid-30 % range of total operating revenue.
IndiGo’s recent performance illustrates how unit spreads can compress when costs outpace revenue per seat, with FY2026 RASK slightly below CASK after a much stronger prior year.
AirAsia X’s disclosed RASK and CASK figures similarly highlight the importance of unit cost control and ancillary systems in sustaining margins.
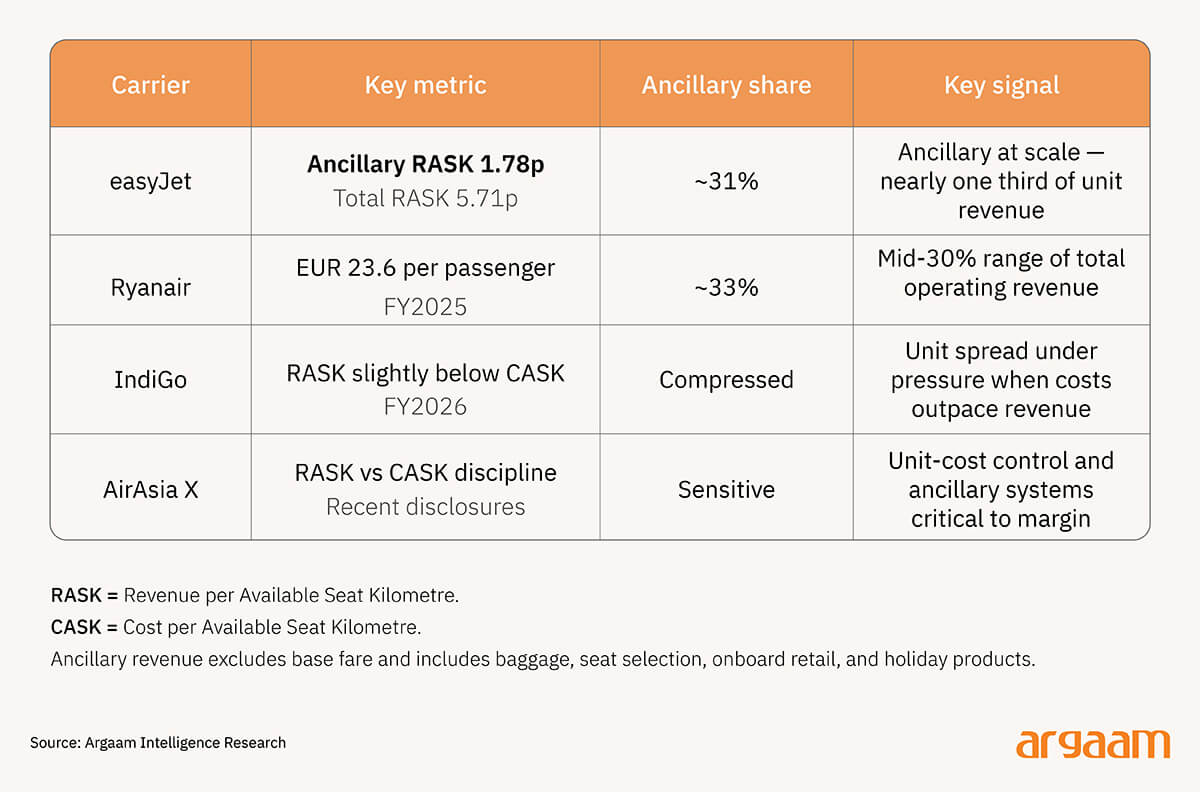
India and the GCC offer more relevant benchmarks for Saudi low-cost aviation than Europe does.
IndiGo built dominant market share in a fast-growing, infrastructure-constrained environment — much like Saudi Arabia today. Its recent swing to a net loss despite market leadership confirms that scale alone does not protect margins when costs rise faster than revenue.
Air Arabia and flydubai show that profitable low-cost economics are achievable within regionally managed aviation frameworks — without replicating the European deregulation model.
Saudi Arabia sits between these two reference points: it has reached meaningful scale faster than most emerging markets, but is still building the ancillary systems, disclosure standards, and infrastructure depth that characterise its more mature comparators.
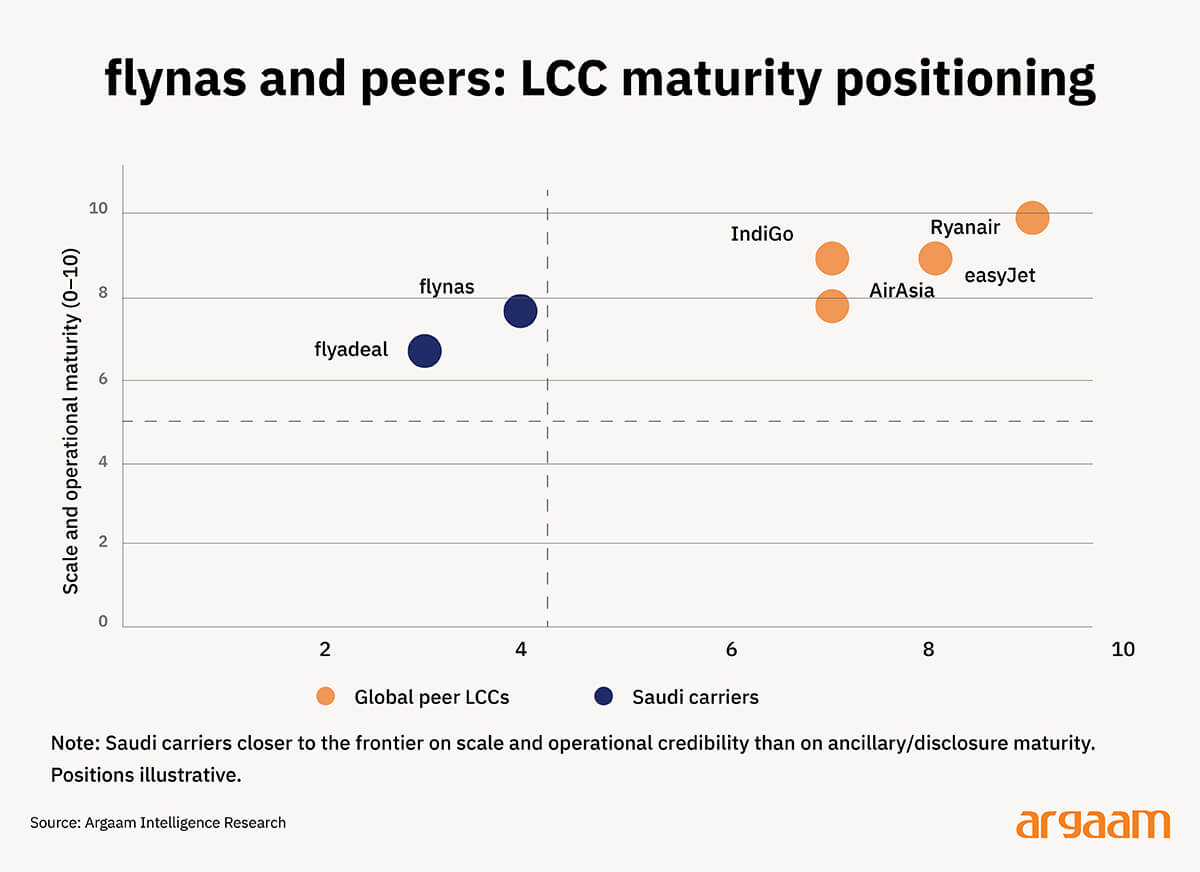
Note on the chart: This chart positions Saudi carriers against global low-cost peers on two dimensions — ancillary revenue maturity and unit-economics disclosure — based on publicly available data.
Ryanair and easyJet anchor the frontier. IndiGo and AirAsia provide emerging-market reference points. Flynas and flyadeal are placed according to their disclosed metrics and documented reporting gaps, not a formal industry score.
It is important to note in the international benchmarking section that pilgrimage traffic gives Saudi carriers a demand reservoir few markets can match. Flynas generated SAR 584 million from Hajj in 2025.
Flyadeal carried around 220,000 Hajj and Umrah passengers, more than doubling year on year. That volume is strategically valuable — but it introduces seasonality and scheduling complexity that smoothly utilised European low-cost networks rarely face.
Infrastructure adds a further distinction. Saudi airports handled 140.9 million passengers in 2025 within a system still in active build-out. New airport investment does not immediately produce the fast turnarounds, low charges, and standardised processing that mature low-cost economics require.
Tourism reinforces the demand backdrop — 123 million inbound and domestic tourists in 2025, SAR 300 billion in spending — but tourism deepens potential; it does not automatically deliver margins.
So Saudi Arabia's low-cost market is not a younger version of Europe's — it is a different kind of market entirely. The demand is there, the scale is building, and the strategic importance of aviation to the national economy is already significant.
What has not kept pace is the monetisation layer — the ancillary products, loyalty systems, and destination revenue streams that turn passenger volume into durable margin. Closing that gap is the central commercial challenge facing Saudi low-cost carriers.