Saudi Arabia's listed REIT market is more consequential than its size suggests — and more complex than its surface uniformity implies.
Nineteen funds controlling SAR 28-30 billion of real estate assets sit largely invisible within a Tadawul dominated by oil and banking giants. Yet this quiet corner of the market reveals a striking architecture: one structural divide — whether a fund's manager is bank-affiliated or independent — orders the entire sector across every dimension examined.
Bank-managed funds borrow conservatively, concentrate in conventional commercial property, and occupy the centre of the market's relationship network. Independent funds gear higher, pursue higher-yielding and more complex asset classes, and remain structurally peripheral regardless of portfolio size. This divide is stable, consistent, and not explained by market conditions alone.
Beneath both groups runs a single dominant risk: interest rates. Saudi REITs behave as duration assets — more bond than equity — driven by the Federal Reserve's rate cycle far more than by the Tadawul. The 2022-23 de-rating was a rate story, not an equity story. And at the centre of the network holding it all together sits not a fund, not a manager, but the Government of Saudi Arabia itself.
The full study sets out the evidence behind each of these findings — and points to the infrastructure asset class this market has not yet built.
The infrastructure gap this market reveals deserves more than a footnote. In the second analysis of this edition, we make the full case for establishing a dedicated infrastructure REIT asset class in Saudi Arabia.
This paper examines Saudi Arabia's listed real estate investment trust market using one of the most comprehensive datasets assembled for this sector.
The research draws on daily price and trading data covering every fund since the market launched in November 2016 — amounting to roughly 36,600 individual data points. It also incorporates quarterly financial statements audited by independent accountants, a detailed register of all 197 properties held across the funds, a weekly model tracking market performance, and a map of how the funds are connected to each other through shared ownership and commercial business relationships.
🔍
Listed Small, Economically Large
Saudi REITs are small relative to the overall stock market — nineteen funds with a combined market value of SAR 14.6 billion, representing just 0.15% of the Tadawul Main Market.
Only a handful of individual funds exceed SAR 2 billion in size. The sector is still developing the liquidity, analyst coverage, and institutional depth seen in more mature markets elsewhere.
However, market capitalisation understates the sector's true economic weight. The nineteen funds actually control SAR 28-30 billion worth of real estate assets — roughly double their listed market value.
The gap reflects two things: the debt these funds carry, and the fact that most fund units trade at a discount to the actual value of their underlying properties.
A more meaningful comparison is against the broader public funds industry rather than the whole stock market.
Measured that way, REITs represent close to a quarter of total assets under management — a figure that better reflects where these funds actually sit within Saudi Arabia's asset management landscape, rather than measuring them against a stock market dominated by Saudi Aramco, SAIBIC and other major institutions in the kingdom.
📊
Leverage and manager type
Of the dimensions along which the nineteen funds differ, leverage is the most sharply separated — and it separates along a single structural line.
The funds fall into two groups of almost identical aggregate size: those run by bank-affiliated asset managers (the asset-management arms of Al Rajhi, SNB/Al-Ahli, Alinma, Riyad and Aljazira) and those run by independent managers (Jadwa, SEDCO Capital, Alkhabeer, Musharaka, MEFIC and peers).
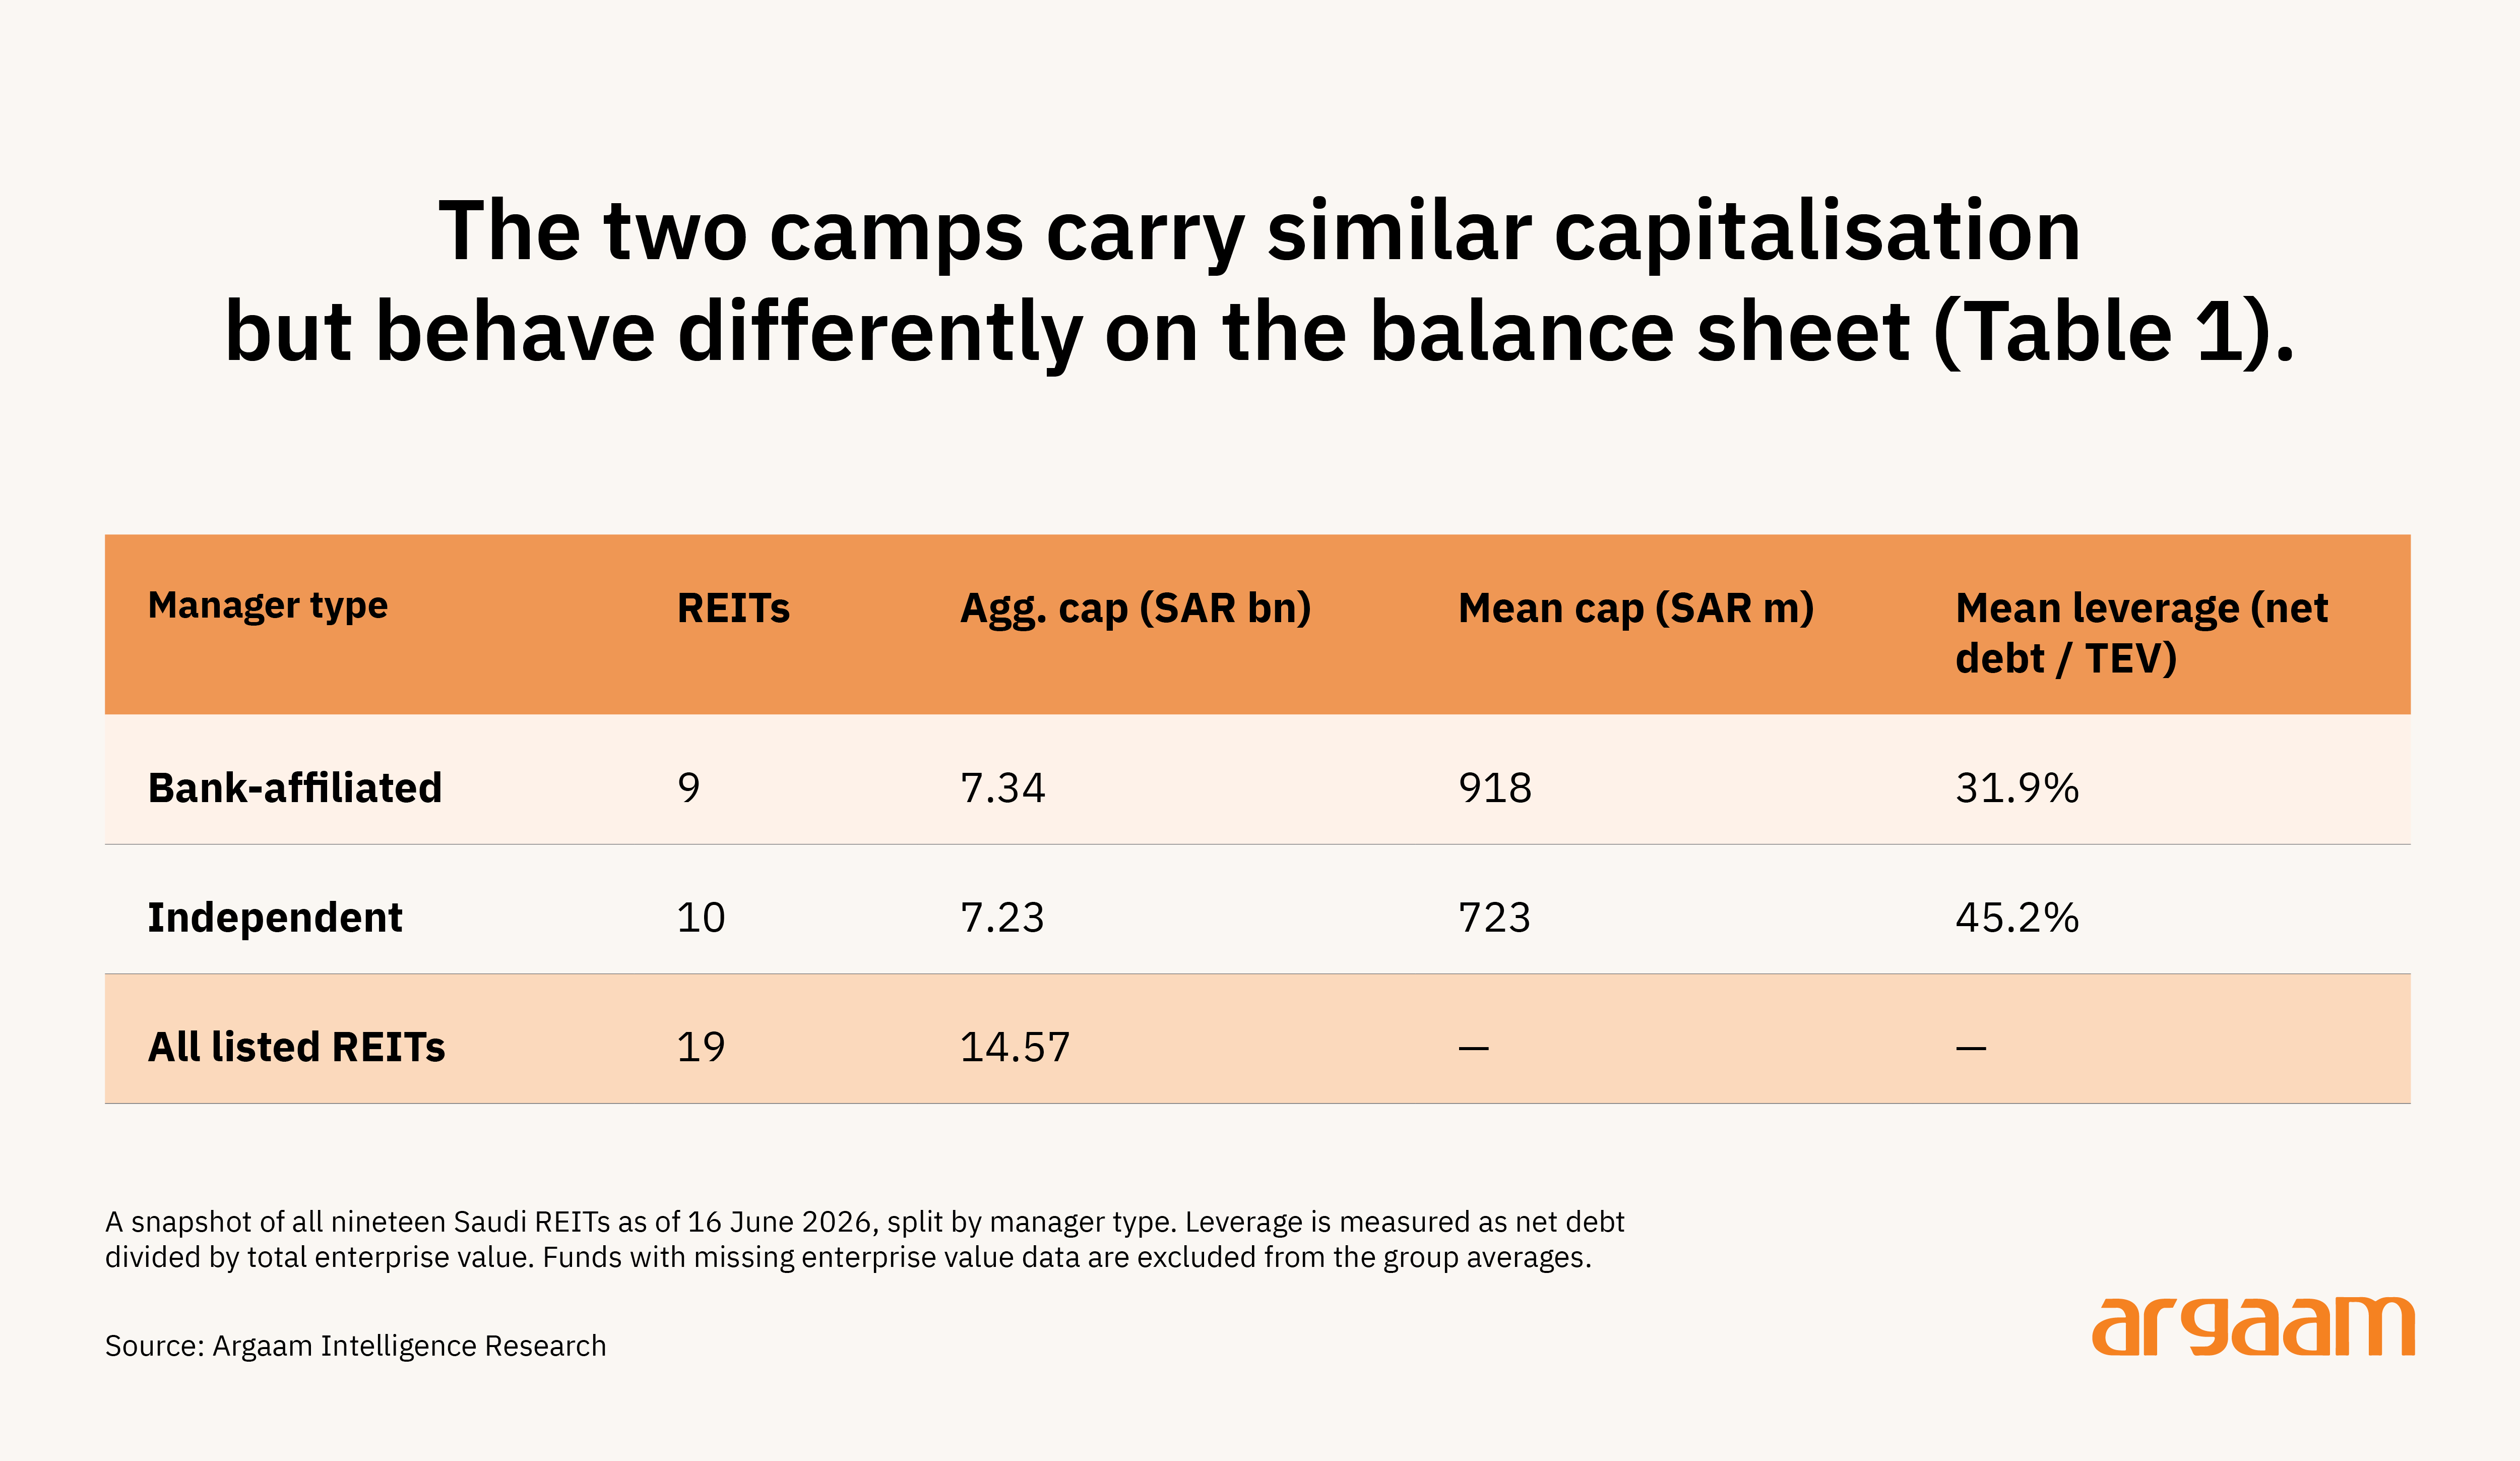
Bank-affiliated REITs run materially lower leverage — a mean net-debt-to-enterprise-value ratio of about 32% — than independently managed trusts, at 45%, and the most aggressively geared funds, those approaching or exceeding 60%, are almost exclusively independent.
The pattern is descriptive but consistent: bank-sponsored managers cluster at conservative gearing, plausibly reflecting the balance-sheet posture of their parent institutions, while independents gear higher, competing on yield and assets under management.
The data shows that bank-managed funds borrow less than independent ones — but it does not explain why. It could reflect more conservative risk management, conflicts of interest between the bank and its own fund, or simply different types of investors. The numbers raise the question without answering it.
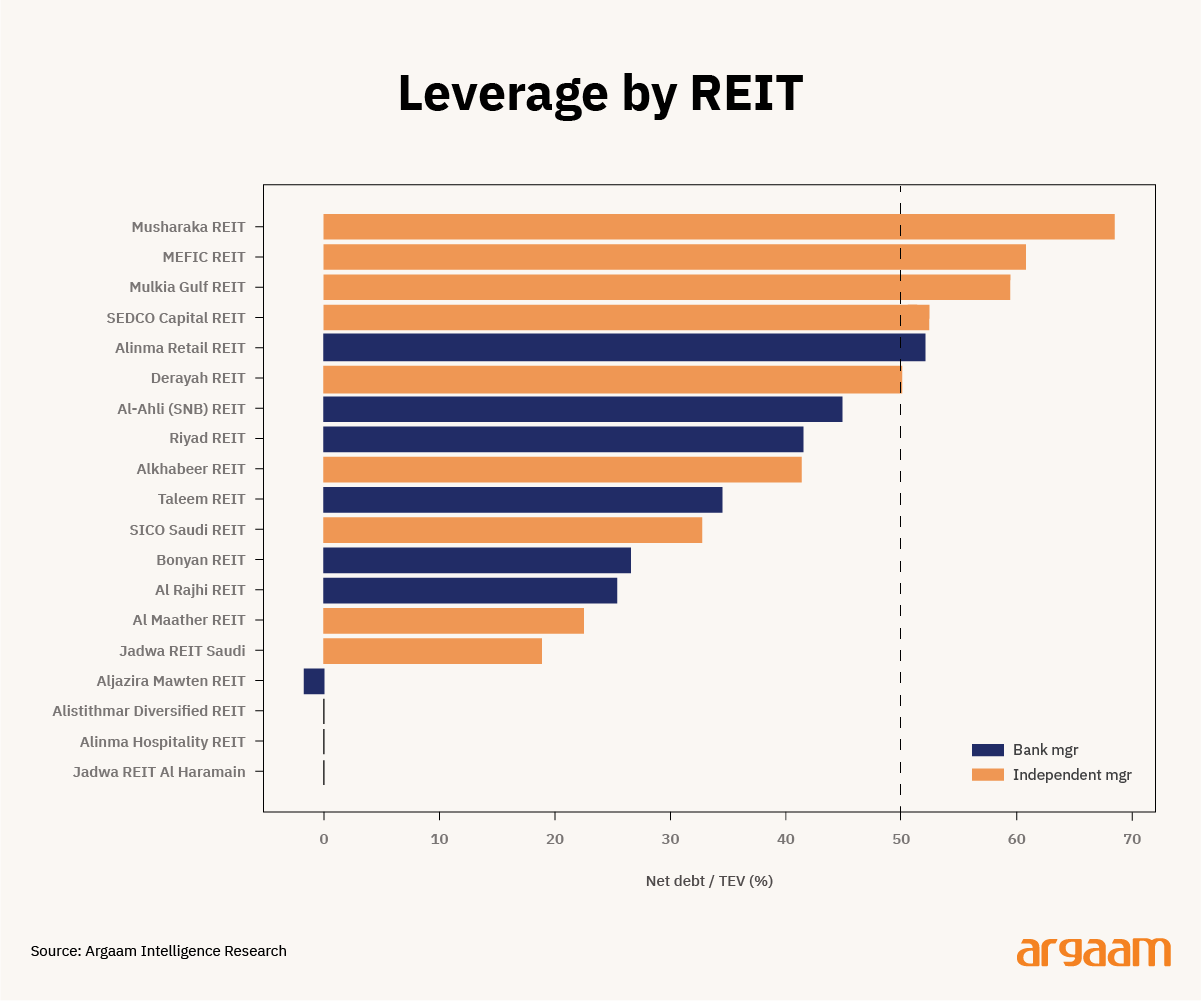
This chart shows borrowing levels across all nineteen Saudi REITs as of June 2026. The dashed line marks the regulatory cap of 50% set by the Capital Market Authority. The pattern is clear: bank-managed funds cluster well below that ceiling, while the most heavily borrowed funds — several approaching or breaching the 50% limit — are almost all independently managed.
🔦
Persistence through time
One day's data alone cannot tell us whether the difference in borrowing levels between bank-managed and independent funds is a permanent feature of how these funds are built, or simply a coincidence of timing.
Extending the snapshot into the full time-series panel resolves this: since roughly 2019 the average net-debt-to-enterprise-value ratio of independently managed funds has run consistently above that of bank-affiliated funds, widening to a gap of 10 to 15 percentage points and never inverting.
Both bank-managed and independent funds are similar in overall market size and price performance — both peaked around 2022 and declined as interest rates rose.
The real difference between the two groups shows up not in how big they are or how their prices moved, but in how much debt they carry on their balance sheets.
The audited financial statements confirm what the market data already suggested. When measuring debt as a proportion of total assets — using figures from the funds' own accounts rather than market prices — independent funds consistently carry more debt than bank-managed ones, and this gap has remained stable since 2019.
Both groups saw their total asset base jump sharply during the 2018-19 period when several new funds listed on the market. Since then, total assets have levelled off at around SAR 12-13 billion for each group and have not grown significantly.
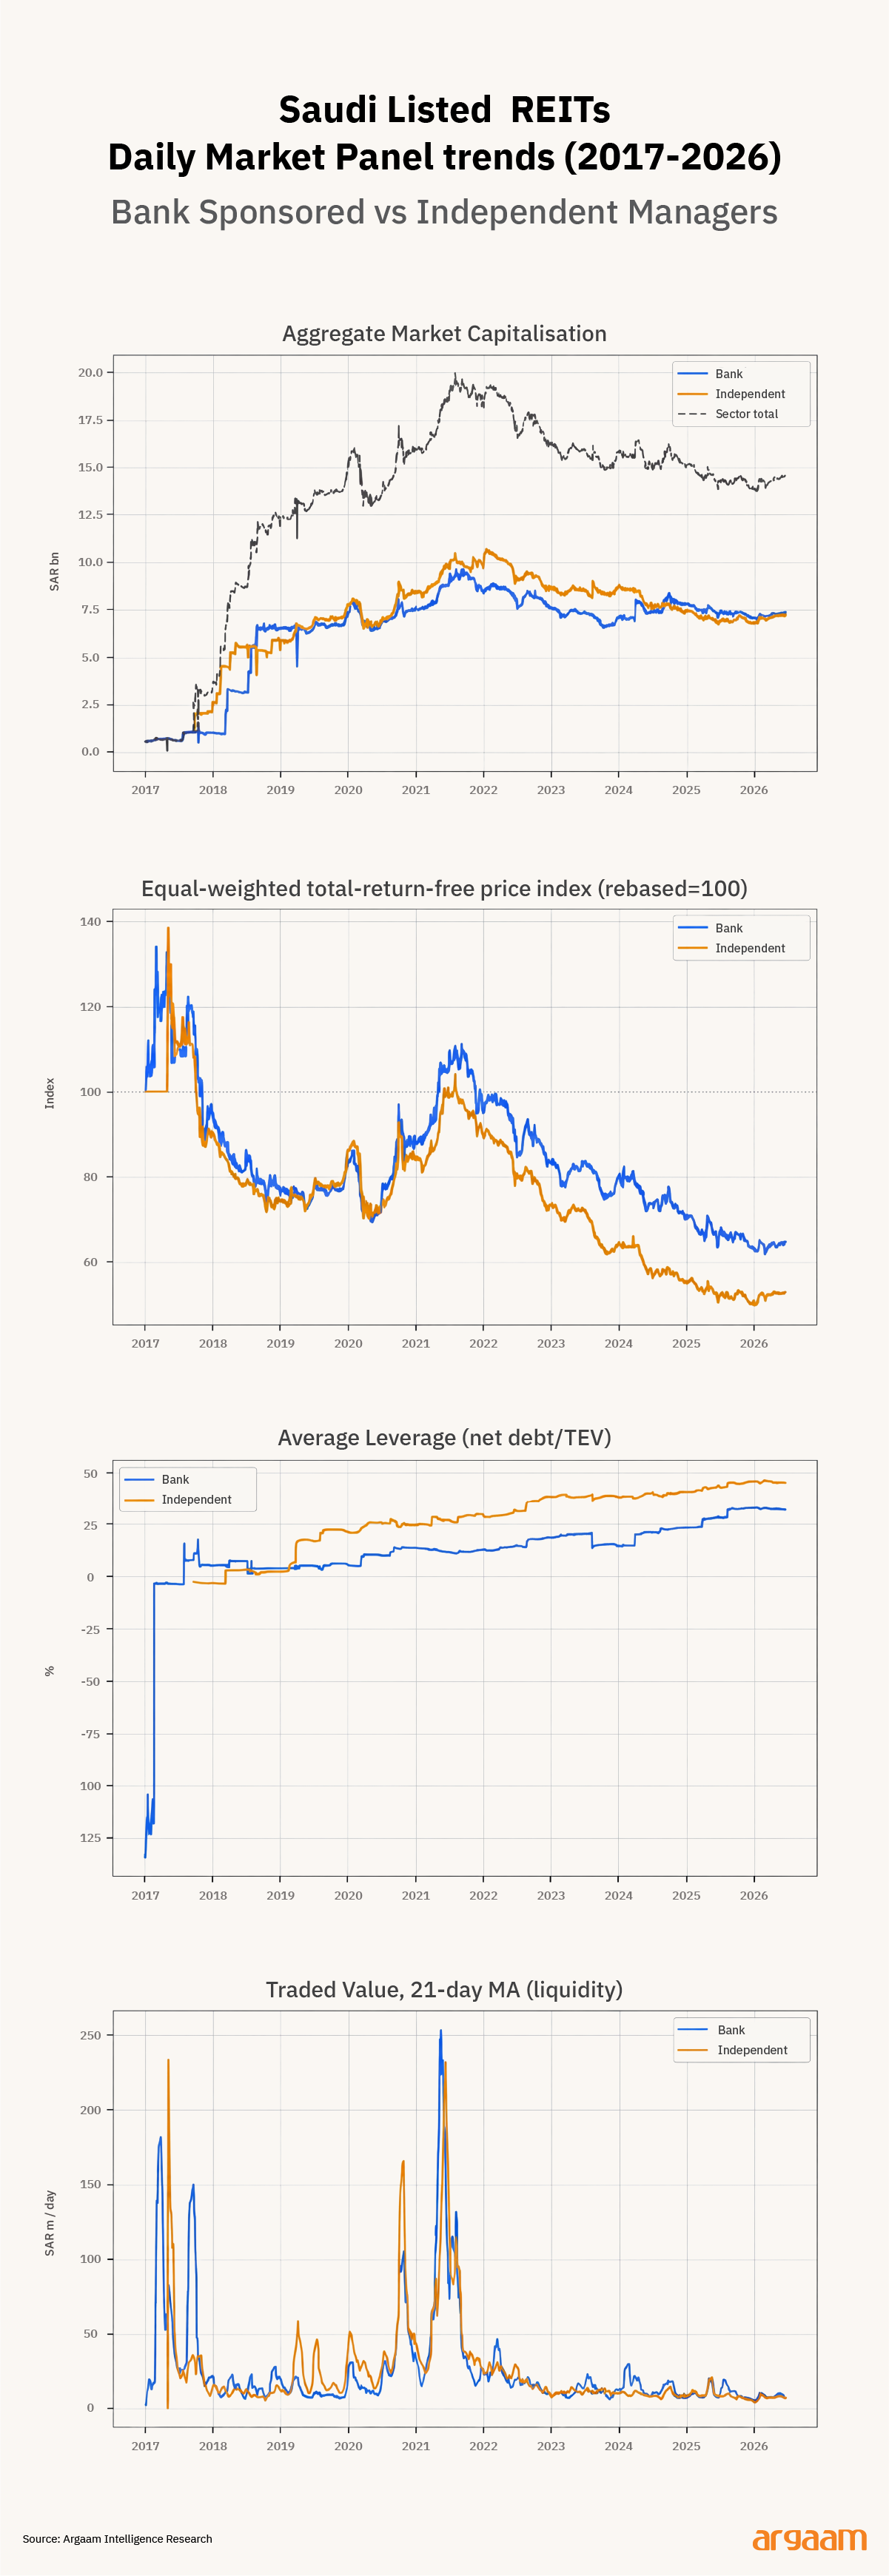
This chart tracks four measures across the Saudi REIT market from 2017 to 2026, split by manager type. It shows total market value, average unit prices, borrowing levels, and daily trading volumes over time. The most telling panel is leverage: after 2019, independently managed funds consistently borrowed more than bank-managed ones, and that gap never closed.
🔍
What sits inside the funds
A property-level asset register, compiled for all nineteen funds from their latest full-year disclosures and cataloguing 197 individual assets, makes explicit what sits inside each structure; the register is reproduced in full, fund by fund, in the companion document “Data, Method and Property Asset Register”.
It shows that the same manager-type axis that sorts leverage also sorts the composition of the portfolios. Three patterns stand out.
First, the conventional commercial classes — retail, office, hospitality and education — divide roughly in proportion to the number of funds, but the operationally demanding, higher-yield classes are overwhelmingly independent: independents hold 87% of residential assets and 78% of logistics and warehouse assets, together with the only industrial and land holdings.
Second, independents run broader books — on average 5.5 distinct asset classes and 12.1 properties per fund, against 3.2 classes and 8.4 properties for bank-affiliated funds.
Third, the most concentrated single-asset vehicles are small bank-sponsored funds (the SNB/Al-Ahli REIT’s single mall is 67% of its value), while geography is uniformly central: Riyadh alone accounts for 52% of located assets.
⁉️
Infrastructure exposure
Whether the sector extends beyond conventional real estate into infrastructure depends on definition. On a strict reading — digital, energy or transport infrastructure such as towers, data centres, pipelines or toll roads — none of the nineteen funds qualifies, and the CMA regime contains no separate infrastructure-REIT category.
This means that even if a fund wanted to hold these assets, there is no legal structure designed to accommodate them. On a broader reading that admits social and economic infrastructure (education campuses, healthcare, logistics and industrial assets), 43 of the 197 catalogued assets, about 22% by count, carry an infrastructure character.
Weighting each fund’s exposure by its market capitalisation gives an infrastructure-attributable value of roughly SAR 3.1 billion — about 22% of listed-REIT capitalisation but only some 0.03% of the circa SAR 9.7 trillion Tadawul Main Market.
Only Taleem REIT is a genuine pure-play (education campuses); Aljazira Mawten, holding a single logistics warehouse, is the only other wholly infrastructure-oriented fund.
This exposure is concentrated in independently managed, diversified vehicles rather than in dedicated structures, and infrastructure remains the sector’s clearest asset-class white space — one with substantial scope for development under Vision 2030.
PS: We examine this angle in depth in the second analysis of this week's edition, where we make the case for establishing a dedicated infrastructure REIT asset class in Saudi Arabia.
💸
Valuation: Discounts, Yields and Returns
We have collected the headline financial metrics for each fund — market price against net asset value, return on equity, operating EBITDA and distribution yield.
Three features stand out.
First, the listed units trade predominantly at discounts to book net asset value: most funds change hands well below the value of their underlying equity, with the widest discounts — MEFIC (-52%), Musharaka (-43%) and Jadwa REIT Al Haramain (-35%) — set against a minority that command premiums, led by Aljazira Mawten (+45%) and by Bonyan, SICO Saudi and Jadwa REIT Saudi at around +20%.
The pervasiveness of discounts is itself a marker of the sector’s immaturity and of the market’s scepticism toward reported carrying values. It signals that investors do not fully trust the property valuations reported in the funds' accounts
Second, almost all Saudi REITs pay out between 6% and 7.6% in annual distributions — a narrow range driven by the regulatory requirement to distribute at least 90% of net income and competition for income-seeking investors. Because yields cluster so tightly, the real differences in returns between funds come not from what they pay out but from how their unit prices and property values move over time.
Third, accounting return on equity is an unreliable guide, because reported net income embeds unrealised property fair-value revaluations — several funds post negative ROE in a given year despite paying uninterrupted distributions.
A funds-from-operations measure would be more informative but is not consistently disclosed; EBITDA is reported here as the cleaner operating proxy.
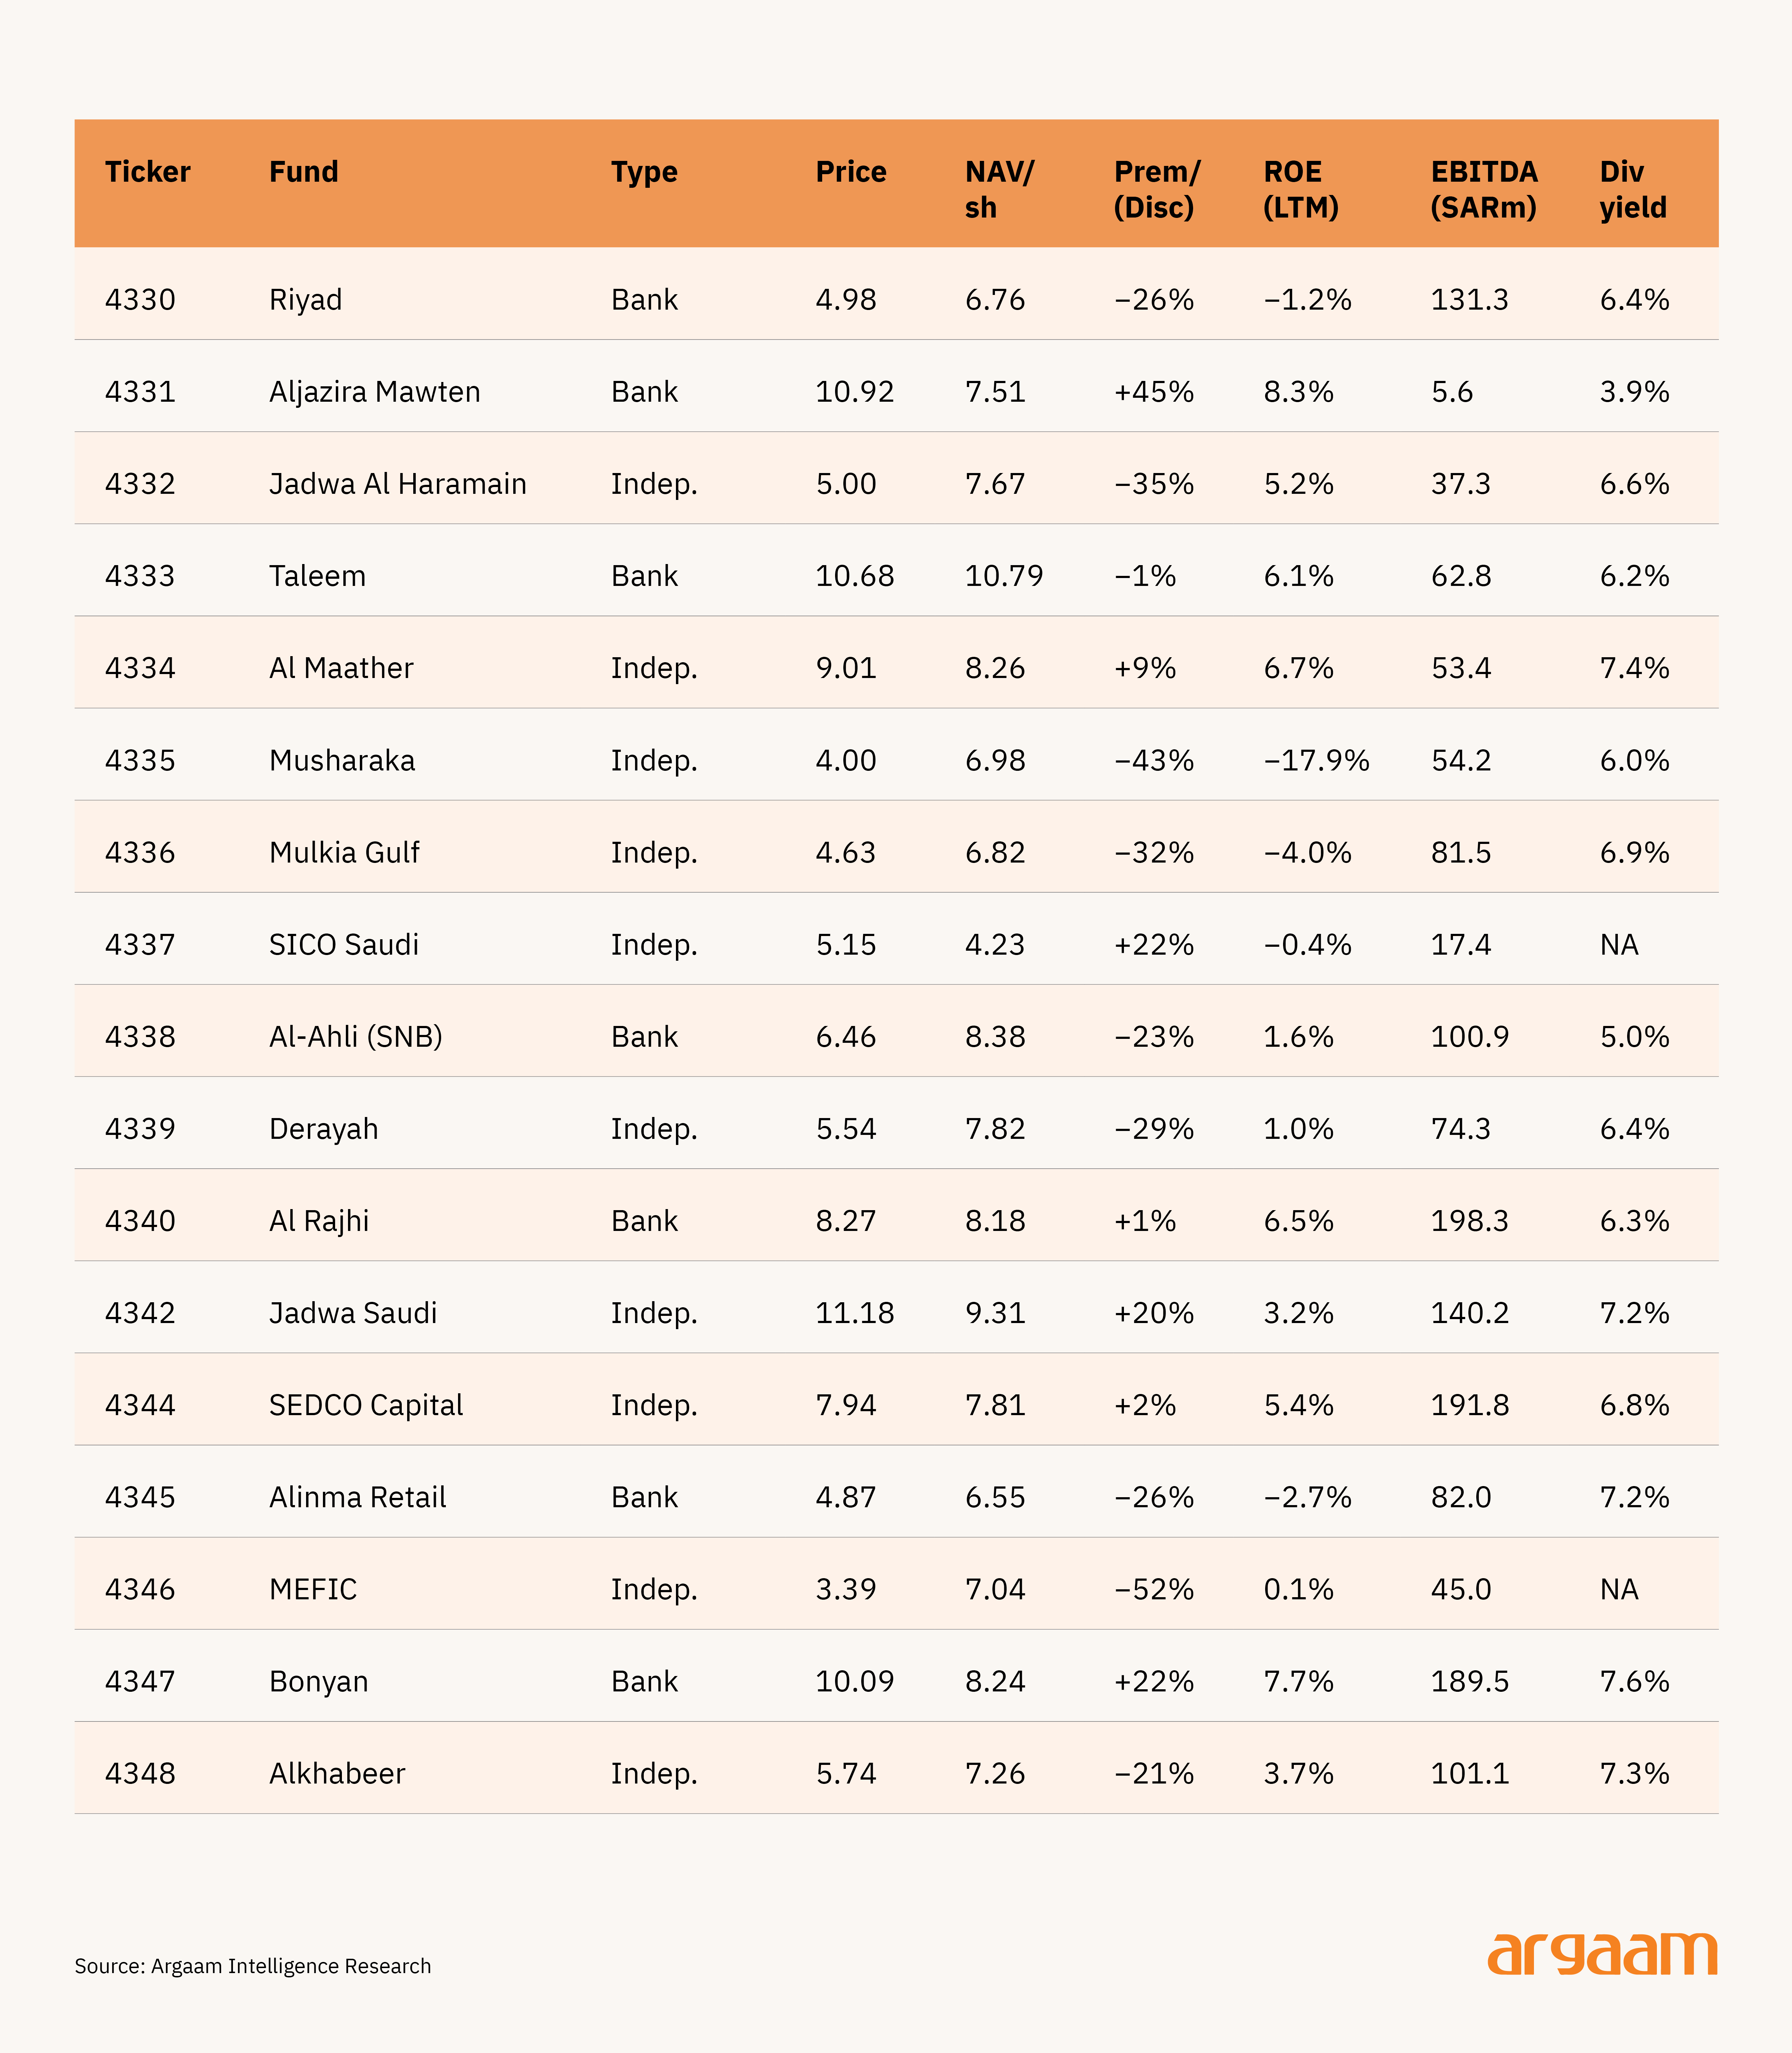
This table shows the key financial figures for each fund as of June 2026. Prices, market values, and share counts are taken from 17 June 2026.
Net asset value per share is calculated by dividing the fund's total book equity from its most recent quarterly report by the number of shares in issue. Income, profitability, and dividend figures cover the most recent twelve months.
Three derived measures are included. The premium or discount shows how much the market price differs from the underlying net asset value — a negative figure means the fund trades below what its properties are worth on paper.
Return on equity measures profitability relative to shareholders' funds, though this figure can swing sharply because it includes unrealised gains and losses on property revaluations. Dividend yield expresses the annual payout as a percentage of the current market price.
Two funds — Alinma Hospitality and Alistithmar Diversified — are excluded due to missing financial data. Dividend figures are unavailable for SICO Saudi and MEFIC.
The discount to net asset value is the single most informative valuation datum in the sector, and it varies systematically with the leverage and composition patterns of the preceding sections: deeper discounts tend to accompany higher leverage, greater retail concentration and higher headline yield, while the funds trading nearest to or above NAV are a mix of the most conservatively geared and the most specialised. Tracking the discount through time and across the manager-type divide is the natural extension of this cross-section.

Interest-Rate Risk: A Duration Asset
Beta, the rate cycle and cap rates
To understand how Saudi REITs perform relative to the broader market, the researchers built a daily price index of all listed REITs weighted by market size, and compared it against the Saudi stock market as a whole.
Because the Saudi riyal has been fixed to the US dollar at SAR 3.75 since 1986, and Saudi interest rates move in lockstep with US Federal Reserve decisions, US Treasury yields serve as a reliable stand-in for Saudi interest rates when running the analysis.
Several clear patterns emerge from a decade of data:
Low sensitivity to the stock market. Saudi REITs move only modestly with the broader equity market — their beta of 0.20 means they capture roughly one fifth of any market swing.
Volatility is also lower, running at 12-13% annually against around 18% for the overall market. This low market sensitivity is consistent across both bank-managed and independent funds, with betas of 0.20 and 0.23 respectively — meaning manager type makes virtually no difference here.
Poor long-term returns relative to risk. The CAPM alpha — a measure of whether an investment delivers returns above what its risk level would predict — is deeply negative at around minus 8% per year.
This does not mean the funds are poorly managed in isolation. It reflects the fact that Saudi REITs have been gradually de-rated over the past decade, meaning investors have been willing to pay progressively less for the same income stream, dragging total returns down over time.
A cap-weighted REIT index is a measure of the overall performance of all listed Saudi REITs combined, where each fund's influence on the index is proportional to its market capitalisation. Larger funds — those with higher market values — have a bigger impact on the index than smaller ones.
So if a large fund rises or falls significantly, it moves the index more than the same move in a small fund would. It is the standard way of measuring how the market as a whole is performing.
Low equity beta does not mean low risk — it simply means the risk comes from interest rates rather than stock market movements.
This played out clearly over the past decade. Saudi REIT prices climbed steadily through the near-zero interest rate years, peaked in 2021-22, then fell sharply as rates rose through 2022-23. The correlation of negative 0.59 between the REIT index and the ten-year yield confirms the relationship: when rates rise, REIT prices fall, consistently and meaningfully.
Adding interest rates to the standard market model confirms that REITs behave as duration assets — sensitive to rate movements in the same way bonds are, while remaining largely indifferent to stock market swings.
The same dynamic is visible in property valuations. The implied capitalisation rate — a measure of the income a property generates relative to its total value — has a sector median of around 6.7%, ranging from roughly 4% for the most expensively priced funds to 9% for the cheapest.
As interest rates rose, investors demanded higher returns from property, pushing capitalisation rates up and prices down. This cap-rate expansion was the primary driver of the sector's price weakness over the rate cycle — not any deterioration in the underlying properties or their income.
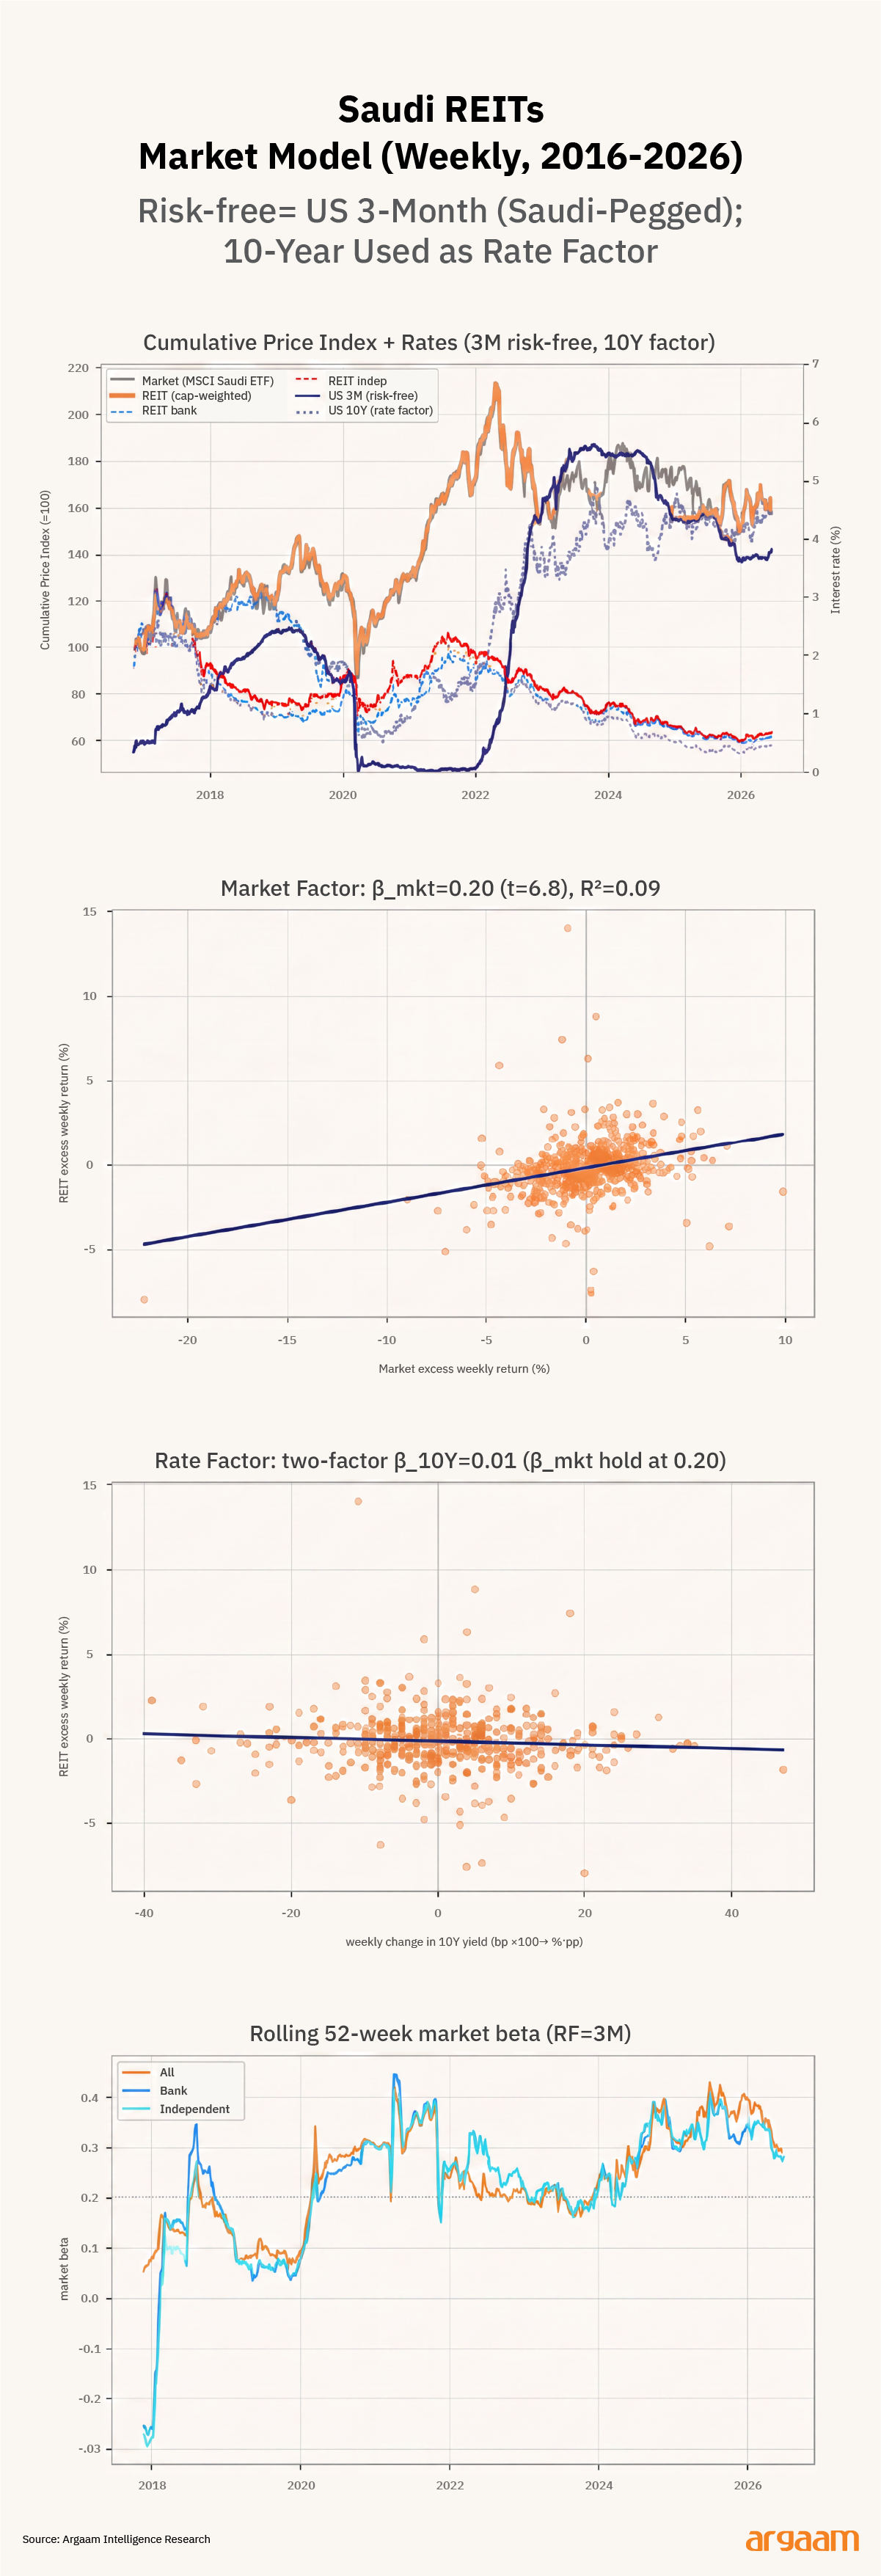
Market model, weekly 2016–2026. Top-left: cap-weighted REIT index and market proxy (rebased = 100), with the US 3-month (risk-free) and 10-year (rate factor) yields on the right axis
Top-right: CAPM fit of REIT excess returns on market excess returns. Bottom-left: the 10-year-change rate factor.
Bottom-right: rolling 52-week market beta by manager type. Market proxy = iShares MSCI Saudi Arabia ETF (USD; riyal pegged to USD); US Treasuries proxy Saudi rates.

Capitalisation rates on appraised values
This section introduces a second and more revealing way of measuring property income yields — one that strips out market pricing distortions to look at the underlying real estate itself.
The first measure — the market-implied capitalisation rate — uses the fund's total enterprise value as the denominator. Because most Saudi REITs trade at a discount to their property values, this market-based measure is inflated by that discount, making the funds look cheaper than their properties actually are.
The second measure uses the independently appraised value of each fund's property portfolio instead — drawn from professional valuers and audited accounts rather than market prices. This gives a cleaner read of what the properties themselves actually yield.
The difference between the two is telling. The market-implied cap rate averages around 6.7%, while the asset-level cap rate on appraised values averages around 5.6% — a gap of roughly one percentage point. That gap is essentially the sector's NAV discount expressed as a yield difference rather than a price difference.
The bank-versus-independent divide persists on both measures. Bank-managed funds show a higher asset-level cap rate of around 6.6% compared to 5.3% for independent funds — meaning the market prices bank REIT income more cheaply regardless of which denominator you use.
Read together, the two measures serve different analytical purposes. The market cap rate reveals price-driven cheapness — how much of the apparent yield comes from the market's discount rather than from genuinely productive properties.
The asset cap rate reveals the true income-generating quality of the underlying real estate. A fund can look cheap on the first measure simply because the market has marked it down, not because its properties generate superior income.
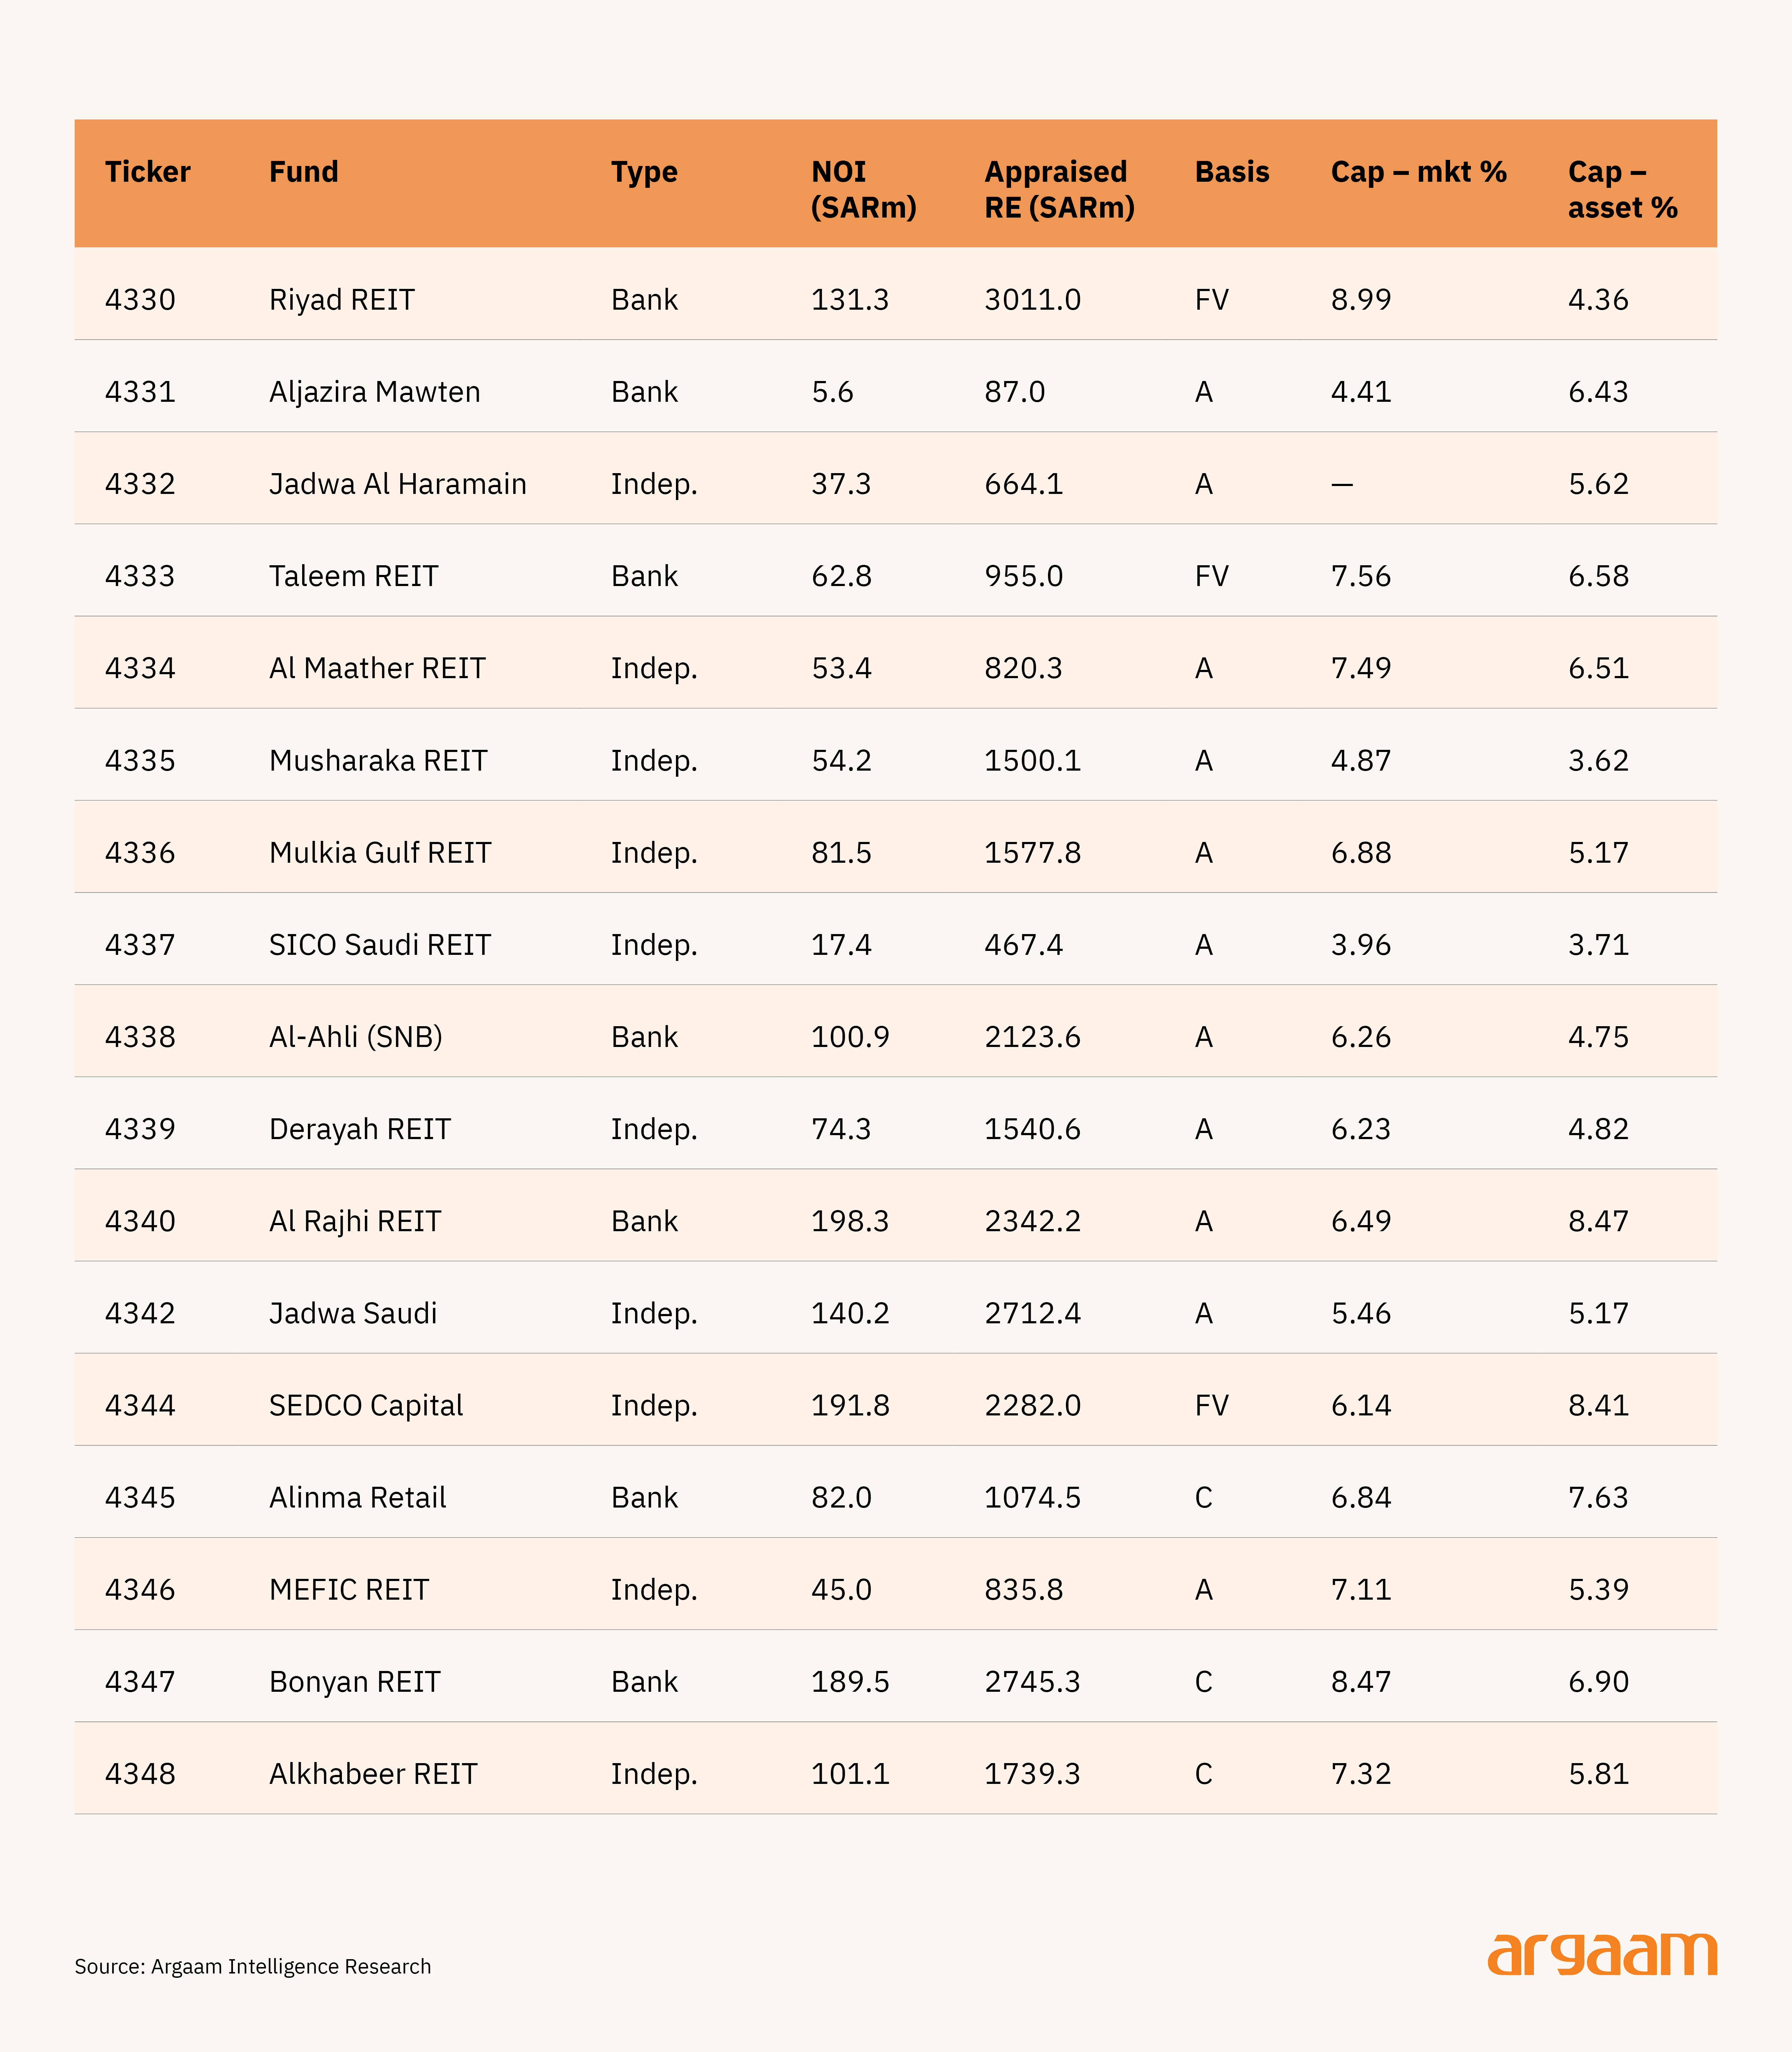
Capitalisation rates by fund. NOI proxied by EBITDA (annual). Market cap rate = NOI / TEV (the inverse of the EV/EBITDA multiple); asset cap rate = NOI / appraised real-estate value from FY2024 valuer reports and financial statements.
Basis: A = independent appraisal, FV = fair value disclosed in the accounts, C = cost-model carrying value (cap rate is an upper bound). Alinma Hospitality and Alistithmar omitted (no NOI).
📝
The Ownership Network and Its Points of Gravity
The cross-sectional findings above treat the funds as a set of independent observations. A complementary question is how they are connected — whether the market has a structure, and if so, which institutions sit at its centre.
To answer this question, we mapped the relationships between the nineteen REITs, their sixteen asset managers, and the nine parent companies that own or sponsor them.
We then combined this ownership map with data from FactSet Revere — a commercial database that tracks real business relationships between companies, such as who supplies whom and who are each other's major customers and partners — to build a complete picture of how the funds are connected both through ownership and through commercial ties.
We built our network map from two sources combined.
The first source is the property register — a detailed record of every asset held across the nineteen funds, which provided information on who owns what, what each fund holds, and which tenants are publicly disclosed as occupying the properties.
The second source is the FactSet Revere database, which added a further layer of commercial relationships — identifying which of the thirty entities in the network are customers of each other, which are suppliers, which have investor relationships, which hold equity stakes in each other, and which have entered into joint ventures together.
Before calculating how central or influential each entity is within the network, we ran a careful de-duplication process — matching different name variations of the same organization to a single entry — to ensure the same company was not counted as multiple separate entities, which would have distorted the results.
The merged graph contains 436 nodes and 453 unique relationships, of which 325 fall in a single connected component.
Looking only at disclosed ownership and fund structure, the nineteen REITs appear to operate in complete isolation — sixteen separate silos with no shared tenants, no co-owned properties, and no common sponsors. Nothing visibly connects them. It is only when the commercial relationship data is added that the true picture emerges and the market reveals itself as a single interconnected network.
🏦
Commercial ties fuse the silos into one bank-anchored web
Adding commercial relationship data transforms the picture entirely. The sixteen isolated silos collapse into a single connected network of 325 nodes — and the glue holding it together is the banking system.
Bank-managed REITs connect to the wider network only through their parent banks, which sit at the centre of broad commercial webs. Remove the banks and the market fragments back into isolated islands. The REIT sector's connectivity is not an intrinsic feature of the funds themselves — it is borrowed from the banking relationships of their sponsors.
The network map makes this visible: the largest nodes — those through which the most connections flow — are overwhelmingly the sponsoring banks and a small number of shared external counterparties, not the funds themselves.
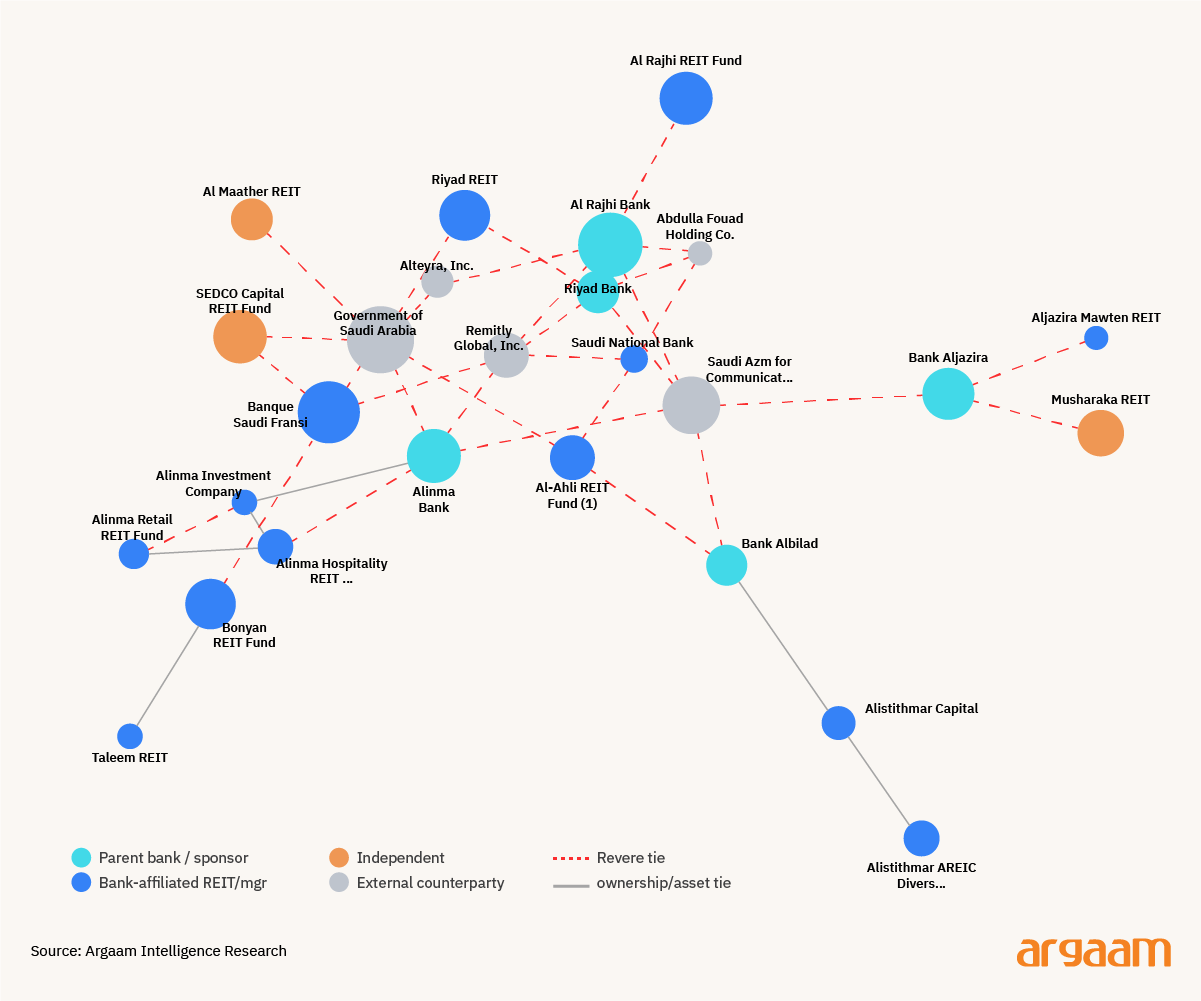
Points of gravity in the merged graph (the gravity model). Node size is betweenness centrality; red dashed edges are FactSet Revere commercial ties; grey edges are ownership and asset relationships. The largest nodes — the central actors through which the network is organised — are the parent banks and a few shared counterparties

The Saudi REIT Market Runs Through Its Banks — and Ultimately Through the Government
Ranked by betweenness, the network organises around the parent banks — Al Rajhi Bank, Banque Saudi Fransi, Alinma Bank and Bank AlJazira — together with a small set of shared external counterparties.
The single most important bridge is the Government of Saudi Arabia (betweenness 0.205), a common customer and research partner across many families, consistent with a state-anchored, Vision 2030 market.
Shared service providers such as Saudi Azm (IT) act as further connective tissue, linking four banks at once.
The central actors are thus not the largest funds by portfolio but the institutions that sit between families: the sponsoring banks and the counterparties they share.
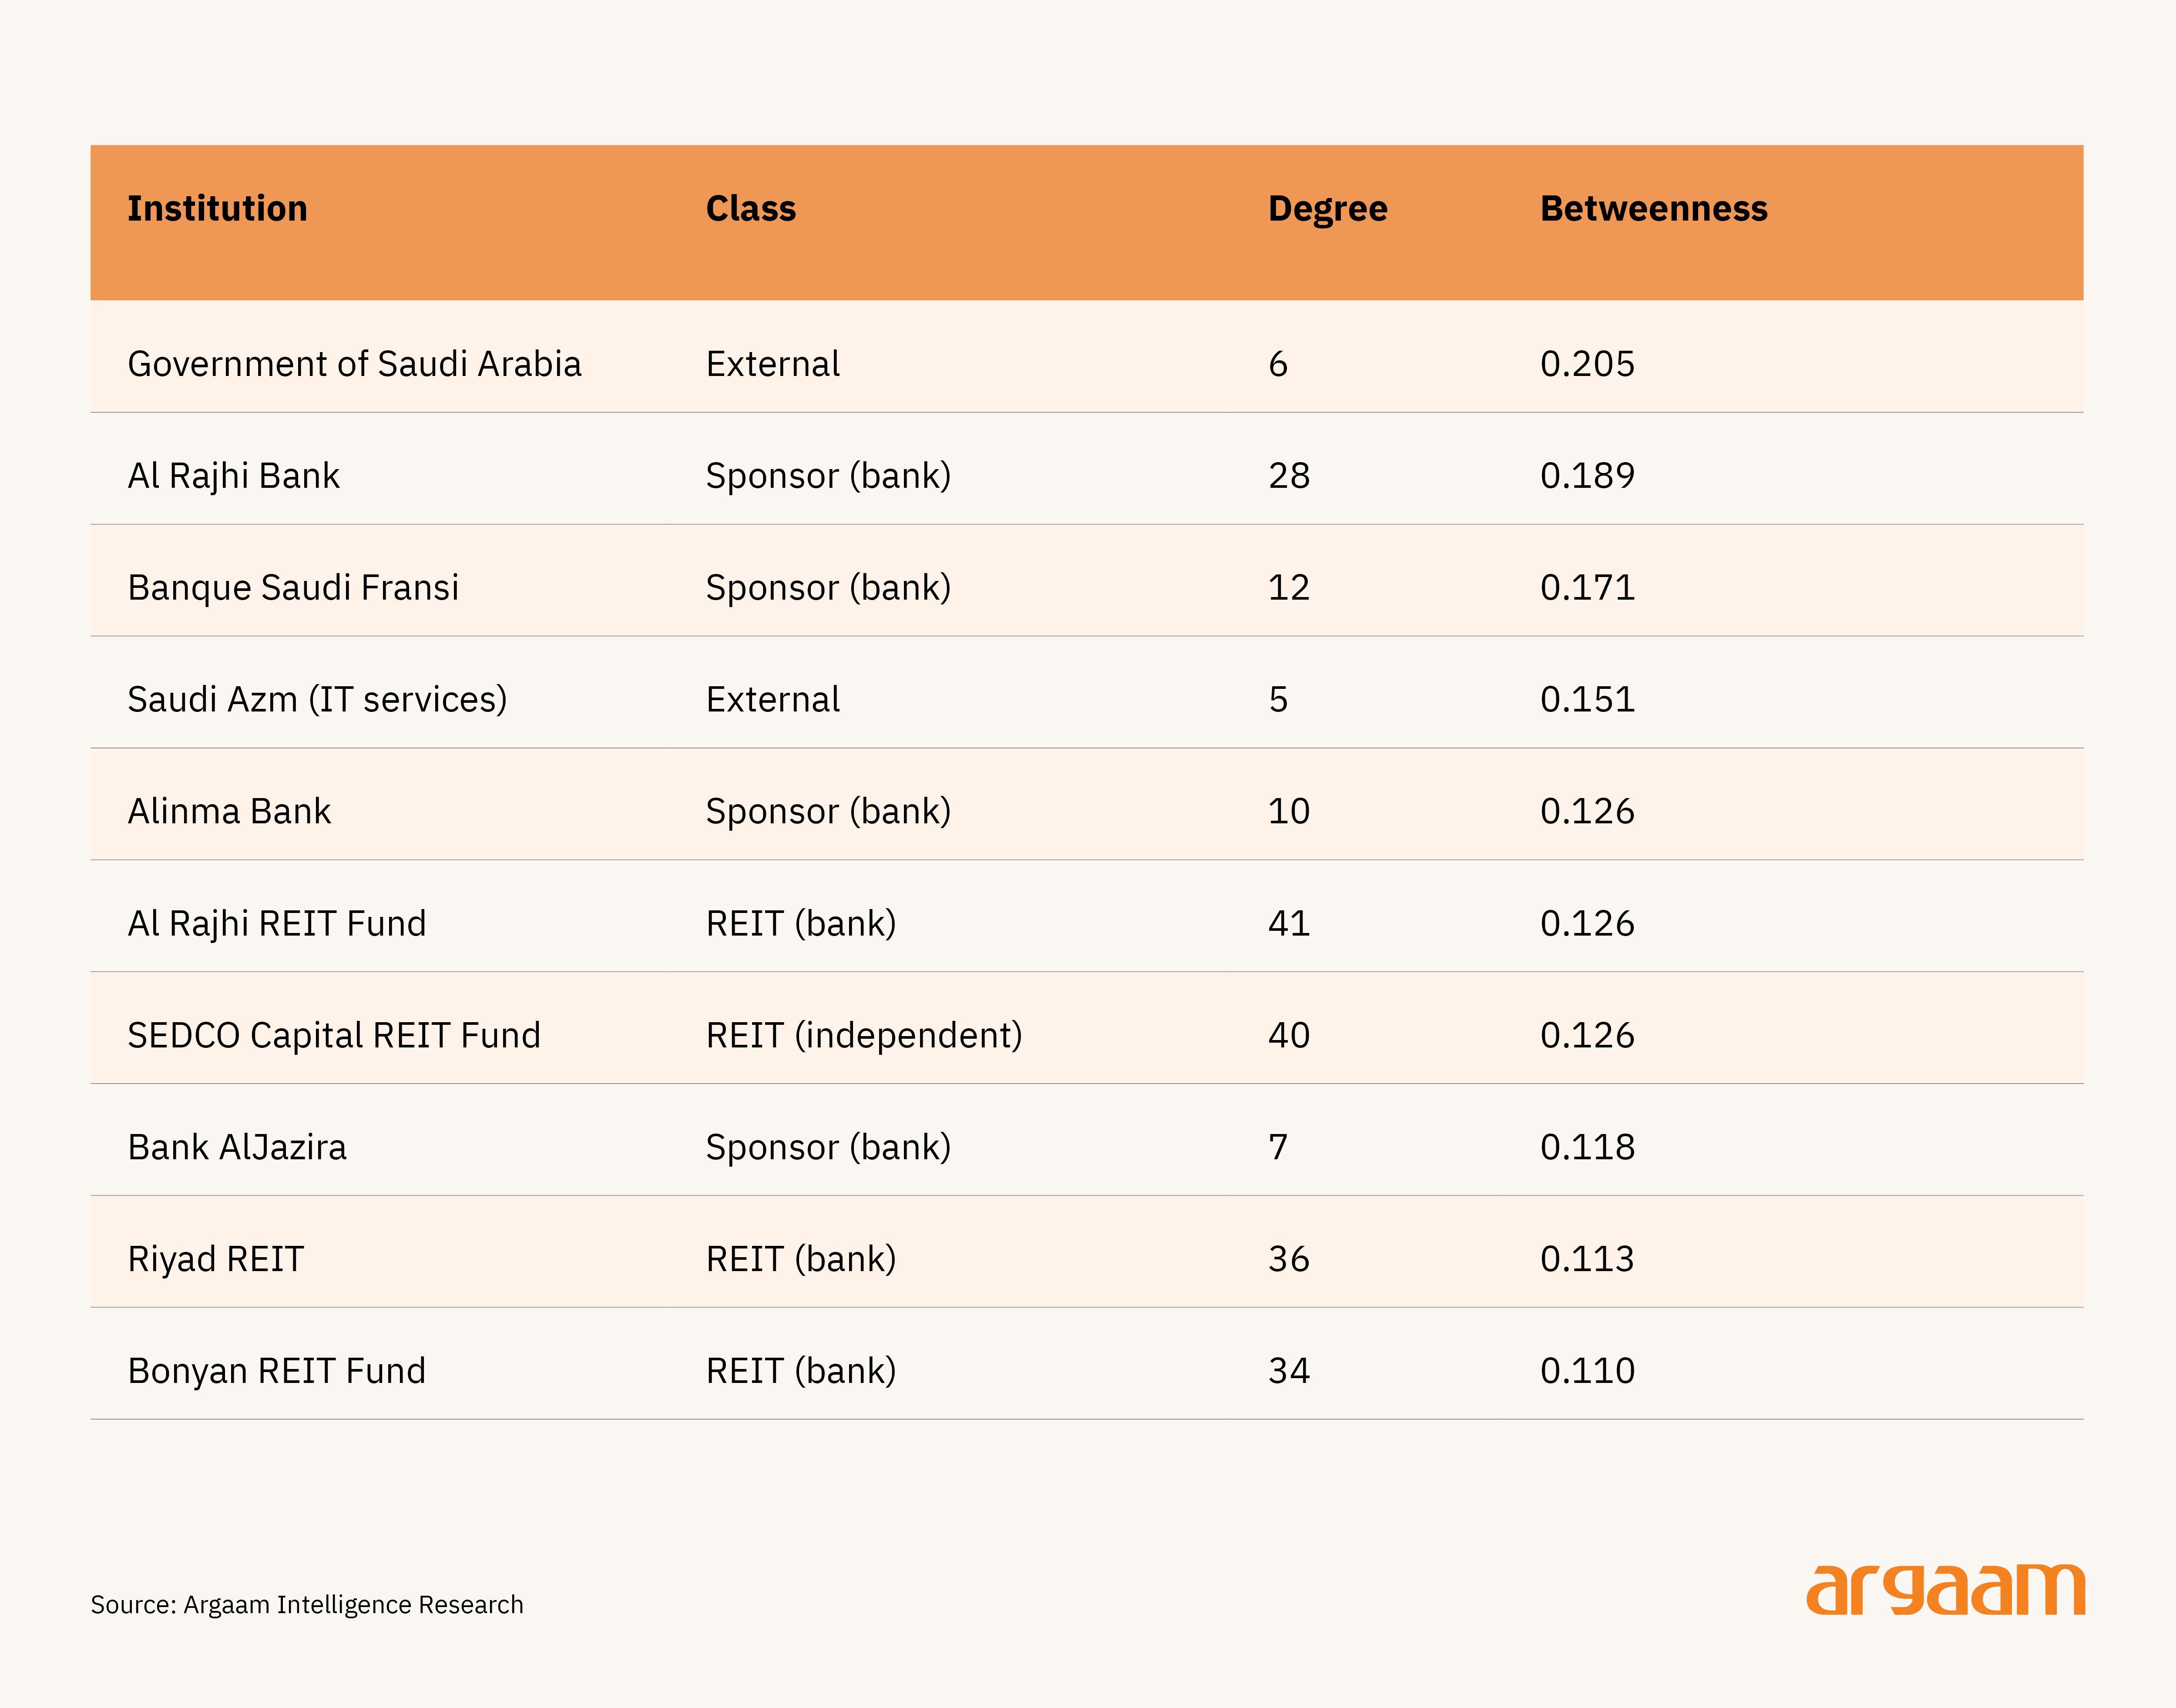
This table ranks the ten most influential institutions in the Saudi REIT network — measured by how often they sit on the shortest path connecting any two other entities. The higher the score, the more the network depends on that institution as a bridge between others.
The dominant players are the parent banks and a handful of shared external counterparties. The single most important bridge in the entire network is the Government of Saudi Arabia — the one entity through which more connections flow than any other.
🤝
The interconnection is commercial, not capital
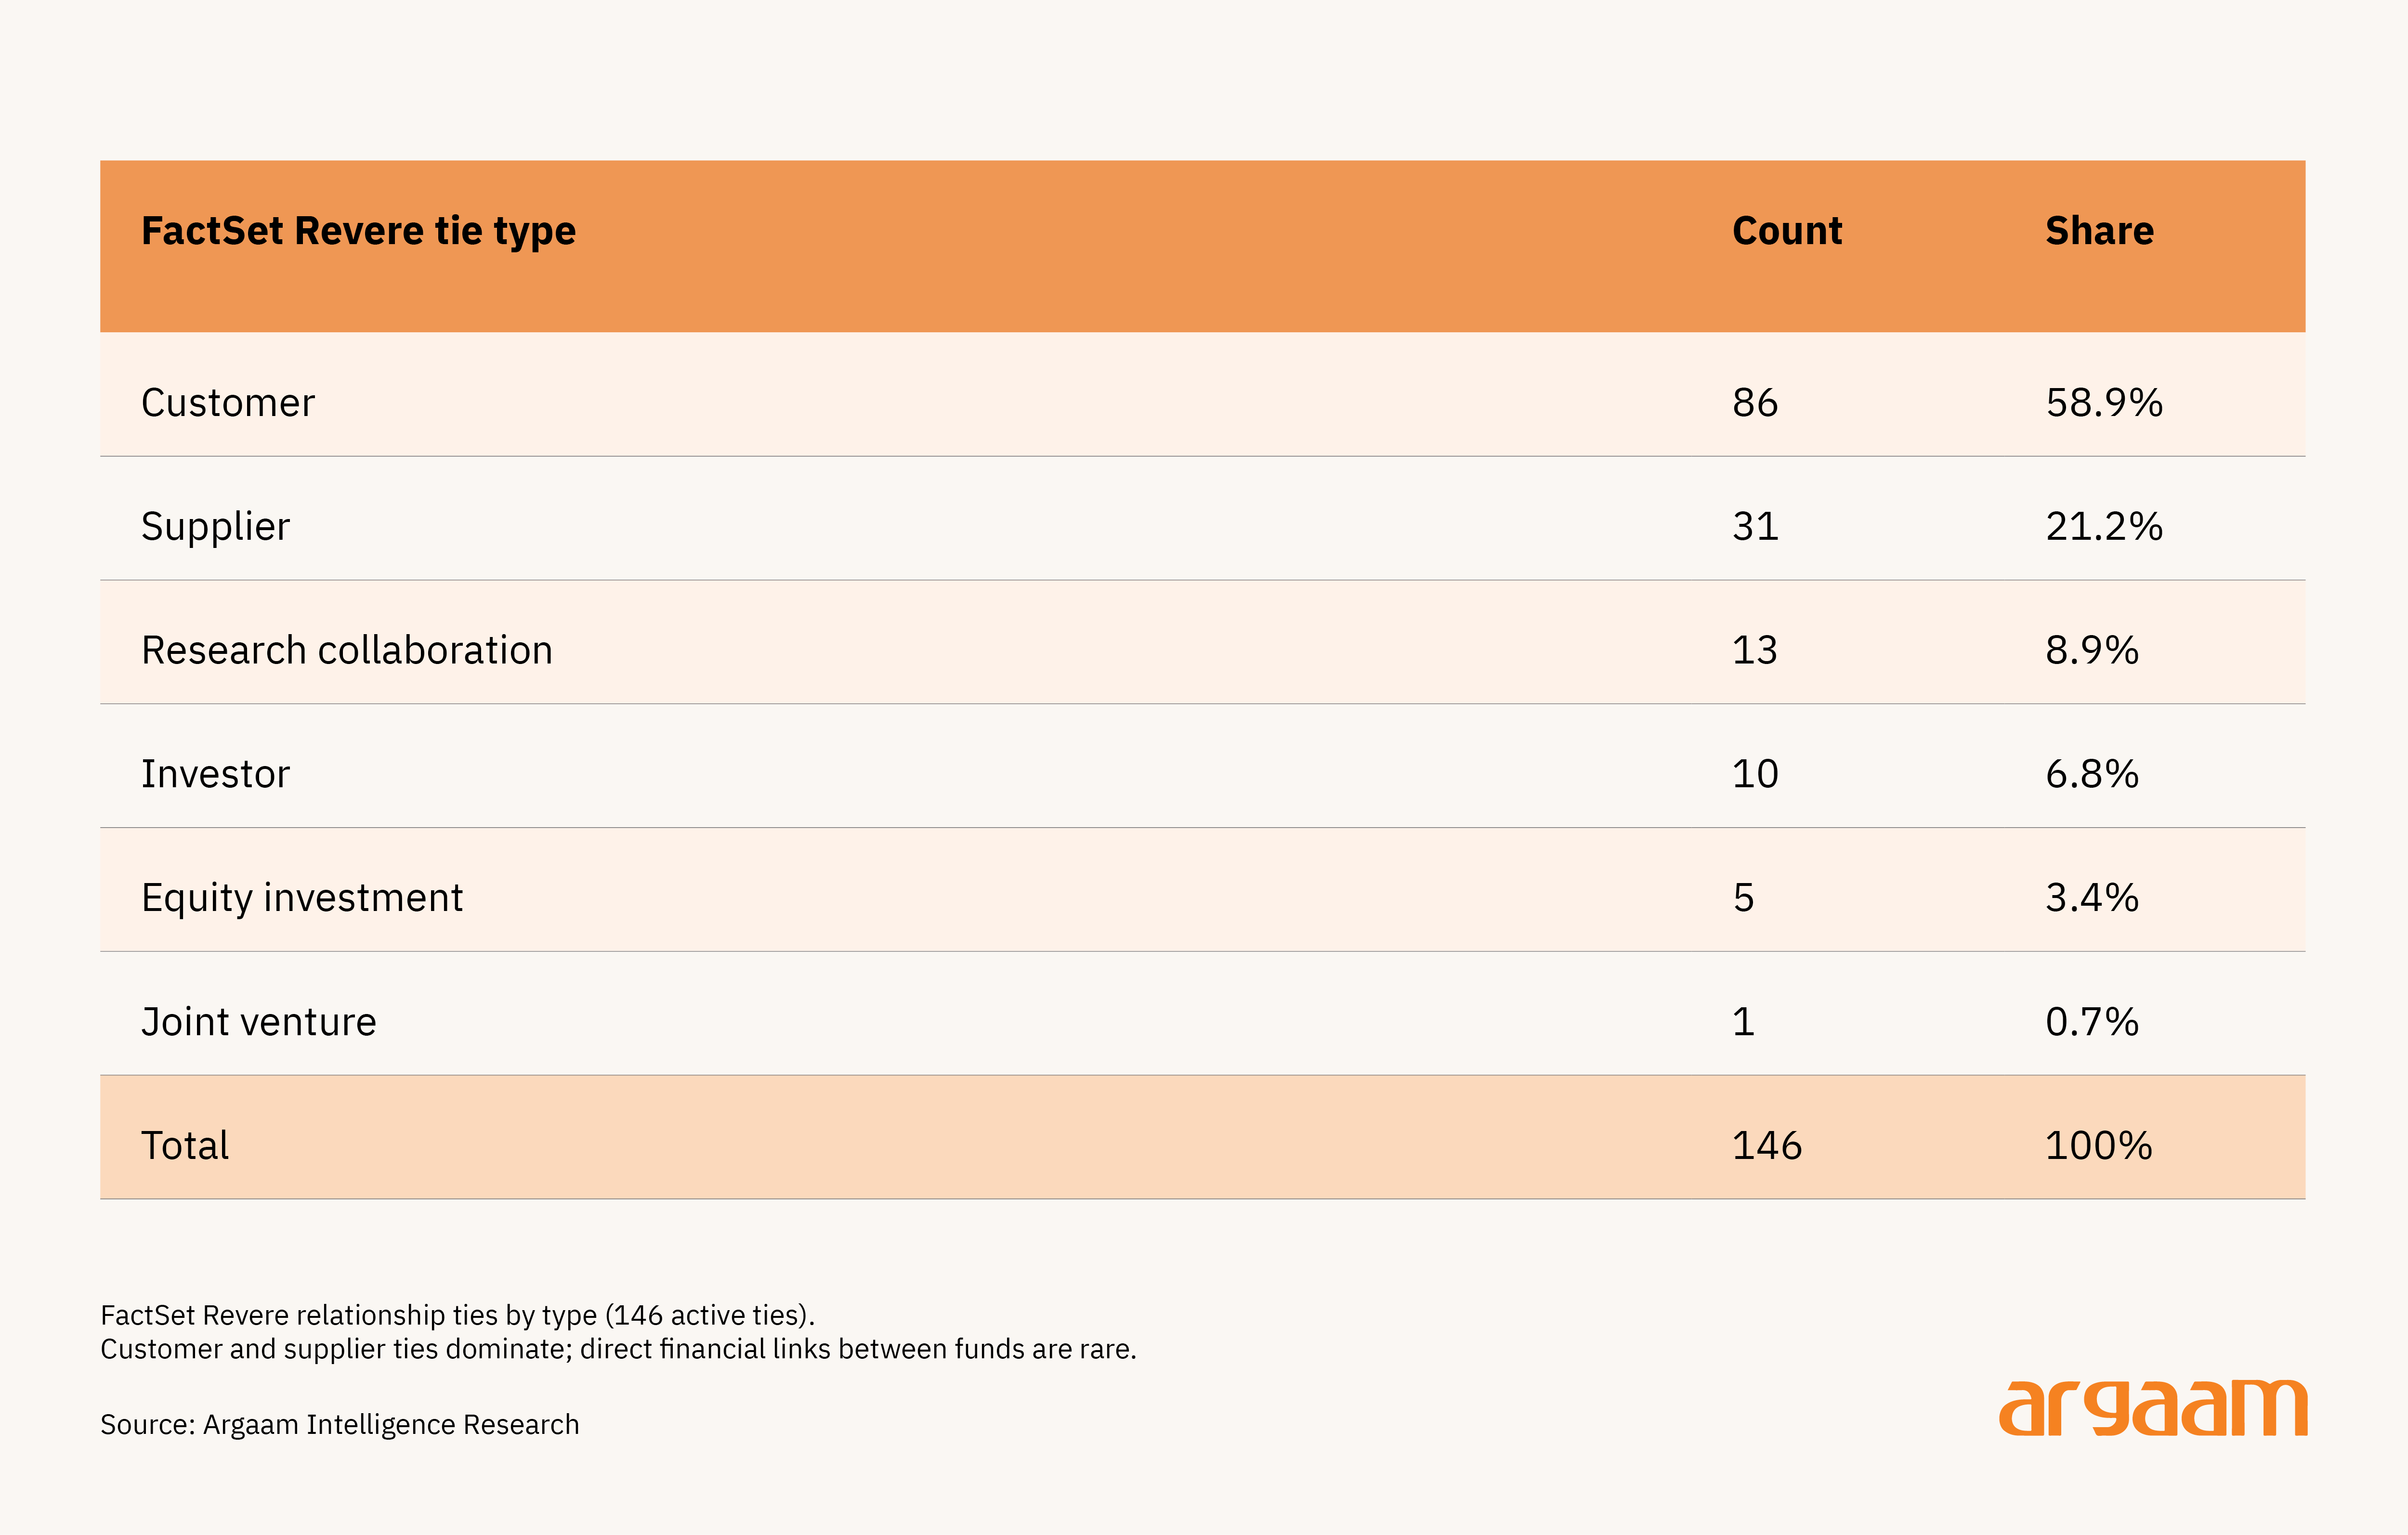
The connections holding the Saudi REIT network together are overwhelmingly commercial rather than financial. Around 80% of the mapped relationships are simply customer and supplier ties between companies — the ordinary business dealings of the parent banks.
Direct financial entanglement between the funds themselves is rare: across the entire sector there are only five equity investments and a single joint venture.
What appears to be a tightly connected market is largely the banks' normal commercial footprint, with the REIT funds attached to it through ownership. The funds are not genuinely interlocked with each other — they simply share the same parent institutions.

Ownership class determines network position
Ownership determines network position — and the divide is stark. Bank-managed funds occupy the centre of the network, acting as the primary bridges between different fund families.
Independent funds, despite holding the largest property portfolios — Derayah, Musharaka, and Al Maather by asset count — sit at the periphery, connected to little beyond their own silo.
The one exception confirms the rule: where an independent fund scores well on network influence, it is because it sits next to a bank. SEDCO Capital reaches the centre only through its proximity to Banque Saudi Fransi. Position in this market is not earned through portfolio size — it is inherited through ownership and proximity to a bank.
Three caveats apply. Bank centrality partly reflects the parent banks' broader commercial scale rather than anything REIT-specific — the funds simply inherit that position through ownership. The analysis covers thirty of forty-four entities, and resolving the remainder would likely reinforce rather than overturn the findings.
And betweenness is used as the headline metric because prestige-based measures prove unstable on this particular network structure. The natural next steps are separating bank-as-bank relationships from REIT-specific ones, and adding board interlocks or co-investment data to sharpen the picture further.

Summary of Findings
Read together, the evidence sketches a coherent portrait of a young asset class. The Saudi listed REIT market is small relative to the equity market but economically larger than its listed capitalisation implies, and it trades at a persistent discount to net asset value that marks both its immaturity and the market’s scepticism toward reported carrying values.
Its defining risk is duration: the sector is driven by the Fed-linked rate cycle far more than by domestic equity conditions. Within the sector's shared interest rate exposure, the clearest dividing line is leverage — and leverage maps directly onto manager type.
Bank-managed funds borrow conservatively while independents gear significantly higher. This gap is stable over time, extends to the types of properties each group favours, and persists however income is measured.
The same bank-versus-independent divide shapes the market's underlying structure. On the surface, the funds appear completely disconnected — sixteen isolated silos with no visible links. It is only the parent banks' broader commercial relationships that fuse them into a single connected network.
The institutions at the centre of that network — those through which the most connections flow — are the sponsoring banks and a handful of shared counterparties, with the Government of Saudi Arabia sitting at the top. Bank-managed funds occupy the core. Independent funds, regardless of portfolio size, remain at the periphery.
Across every lens used here — leverage, portfolio composition, valuation and now network position — the manager’s ownership is the single characteristic that most consistently orders the Saudi REIT market.