Most assessments of Saudi Arabia's economy begin in the wrong place. They reach for oil revenues, fiscal balances, or the rising share of output classified as non-oil — each a legitimate data point, none of them the right test of whether an economy is genuinely transforming.
To understand why, it helps to start with a structural lesson from a very different economy in China.
Saudi Arabia recorded a merchandise trade surplus of SAR 90.5 billion in the first quarter of 2026, up 43.7% year-on-year and 60% higher than in Q4 2025 — a figure that looks, at first glance, like a straightforward signal of economic strength. But a rising trade surplus is not always the signal it appears to be.
China's experience over the past decade offers a useful illustration of how the same headline figure can carry very different meanings depending on what is driving it — and why aggregate external balances, taken alone, can obscure as much as they reveal about the underlying health of an economy, and why Saudi Arabia's surplus tells a more nuanced story when examined properly.

The surplus is not the lesson. It is the symptom
China's trade surplus has widened dramatically, reaching approximately $1.1 trillion in 2025 — running roughly 40% above its 2022–24 pace. Conventionally, that surplus is read as evidence of industrial competitiveness — the reward for leadership in electric vehicles and advanced manufacturing.
The underlying data tell a different story. Industrial output has run approximately 7% below its pre-pandemic trend since 2022, and consumer spending roughly 17% below trend.
The surplus widened not because Chinese producers grew stronger but because Chinese households grew weaker. Output that domestic consumers could not afford to absorb was exported instead.
The surplus is not the lesson. It is the symptom. The lesson from China is that investment-led growth — state-directed capital allocated at scale into manufacturing capacity and infrastructure — can generate impressive aggregate numbers while leaving households with a diminishing share of what the economy produces.
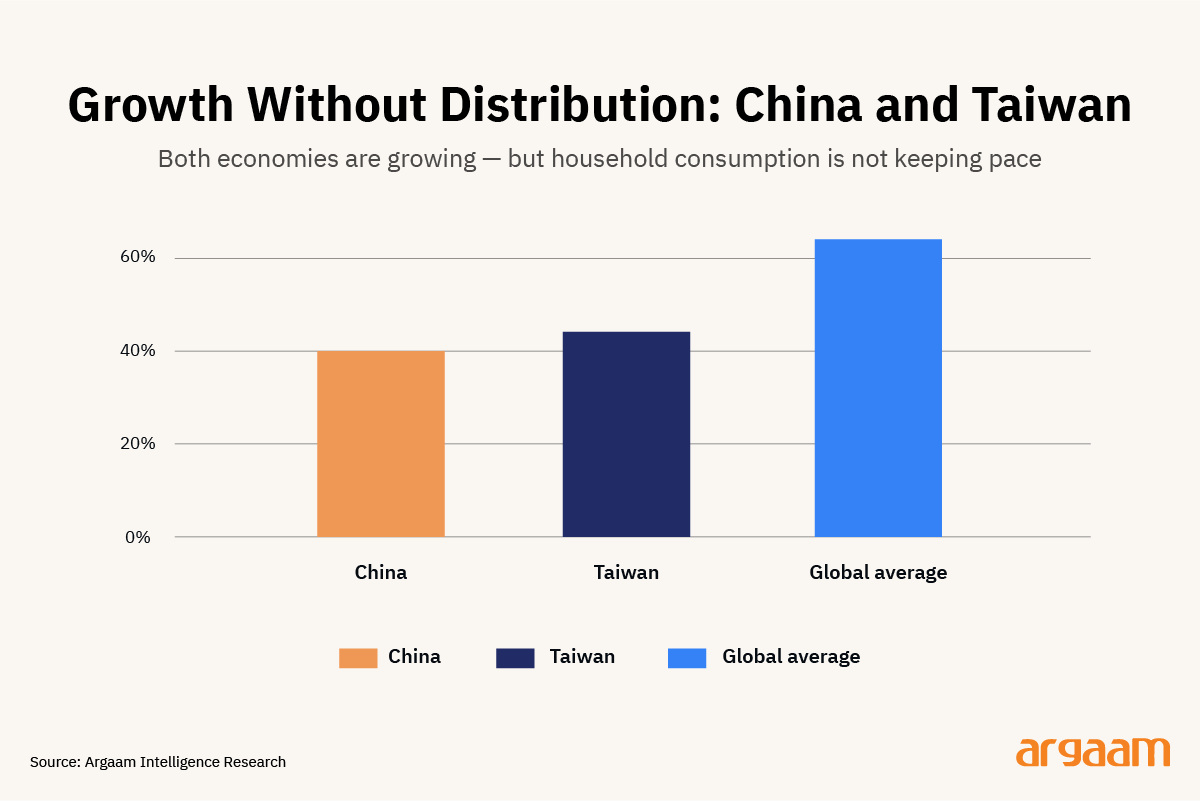
China's household consumption share has declined steadily to approximately 40% of GDP, against a world average of around 64%.
Taiwan presents a related but distinct version of the same pattern. Its trade surplus has surged — now running at approximately 30% of GDP — not because domestic demand collapsed but because the world is buying its semiconductors in vast quantities.
In 2025, Taiwan's GDP rose to 7.6% while private consumption grew only 1.35%. The chip revenues are accumulating disproportionately in corporate profits and reserves rather than flowing broadly to households.
Taiwan's household consumption stands at approximately 44% of GDP — below the global average of 64% and below its own potential given the scale of its export windfall.
Three economies, three surpluses — each with a different cause, each with a different implication for household welfare. The surplus, on its own, tells you almost nothing about whether growth is working for the people generating it.
That reframing establishes the right test: not what an economy exports or what its surplus looks like, but whether the gains of growth are reaching households broadly enough and durably enough to generate private demand that can sustain itself without continued state support.

Saudi Arabia's Surplus — And What It Actually Reflects
Saudi Arabia's Q1 2026 trade surplus of SAR 90.5 billion was driven by total merchandise exports of approximately SAR 312.8 billion against imports of SAR 222.3 billion, with Asian countries absorbing the largest share of Saudi exports at SAR 229.2 billion.
That surplus is real. But it moves with the oil price, not with the strength of domestic demand — and in that sense it shares nothing analytically with China's surplus, whose widening reflected suppressed household consumption.
The current account tells a more complete story. After a projected deficit of 2.7% of GDP in 2025, the World Bank's April 2026 forecasts point to a current account surplus of 3.3% in 2026 — a shift that reflects rising net foreign assets, stronger export performance, and moderate domestic demand.
Saudi Arabia's current account position reflects the oil price cycle more than any underlying structural shift. The current account registered a deficit of 0.5% of GDP in 2024, down from a surplus of 2.9% in 2023, primarily reflecting a decline in oil export proceeds, higher machinery and equipment imports, and stronger remittance outflows.
Through 2025, pressure continued: Official figures show the current account balance shifted into a deficit of SAR 10.5 billion in Q1 2025, reversing sharply from a surplus of SAR 15.4 billion in Q1 2024.
The World Bank projects Saudi Arabia's current account returning to a surplus of 3.3% of GDP in 2026, following a projected deficit of 2.7% in 2025. That projection, however, rests on an assumed oil price recovery rather than a structural shift in the external balance.
The IMF's own medium-term forecast points to the current account returning to deficit, reaching approximately -3.4% of GDP by 2027 and -3.2% by 2030, as giga-project import demand and remittance outflows reassert themselves.
The roughly seven-percentage-point swing between the two institutions' 2027 projections is almost entirely explained by differing oil price assumptions — which is precisely the point: Saudi Arabia's external balance continues to reflect the influence of global oil market conditions — a characteristic shared by all major hydrocarbon producers and one that is entirely consistent with an economy in active structural transition.
A current account position that moves as significantly as Saudi Arabia's across successive years reflects the continued influence of global commodity markets on the external balance — a feature shared by all major hydrocarbon exporters and one that is entirely consistent with an economy undergoing structural transformation.
The external balance, in this reading, is neither a measure of success nor a cause for concern. It is an accounting identity: the difference between what the economy produces and what it absorbs domestically, with the oil price remaining a dominant variable on the production side.
The non-oil share of GDP carries a related distortion. It is not a fixed measure of diversification but a ratio whose denominator shifts with the oil price. When crude revenues moderate, the non-oil share rises arithmetically — even when the underlying composition of the economy has not materially changed.
At the softer oil prices prevailing through 2025, oil and gas activities accounted for approximately 17% of GDP; real GDP for oil activities stood at SAR 1.3 trillion, non-oil activities at SAR 2.7 trillion, and government activities at SAR 648.4 billion.
The same non-oil economy that appears to represent 83% of output at $70 oil would represent a smaller share at $100 oil, with no change in actual economic activity beneath the ratio. Tracking the non-oil share without adjusting for price effects is a measurement error dressed as a conclusion.
These, then, are the three metrics most commonly applied to Saudi Arabia — the trade surplus, the current account balance, and the non-oil share — and none of them answers the question that matters.
By the standard the China comparison established, the right test is not any of these. It is whether the gains of growth are reaching households broadly enough and durably enough to sustain private demand independently.

What The Right Test Actually Shows
Saudi Arabia's real GDP grew 3.0% year-on-year in Q1 2026, driven by a 2.9% increase in both oil and non-oil activities and a 1.5% rise in government activities.
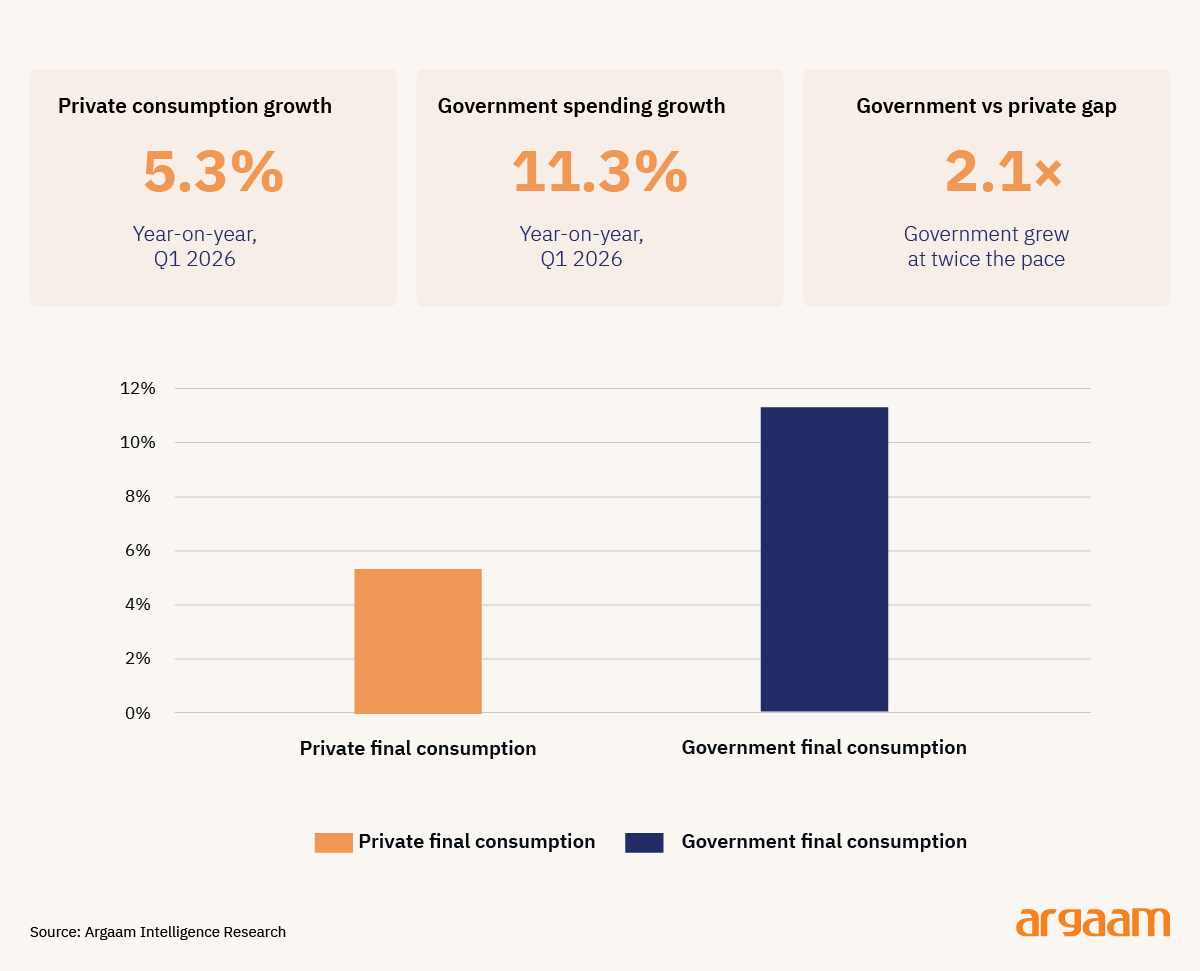
Private final consumption expenditure rose 5.3% from a year earlier, sustaining momentum through a period of acute regional geopolitical stress.
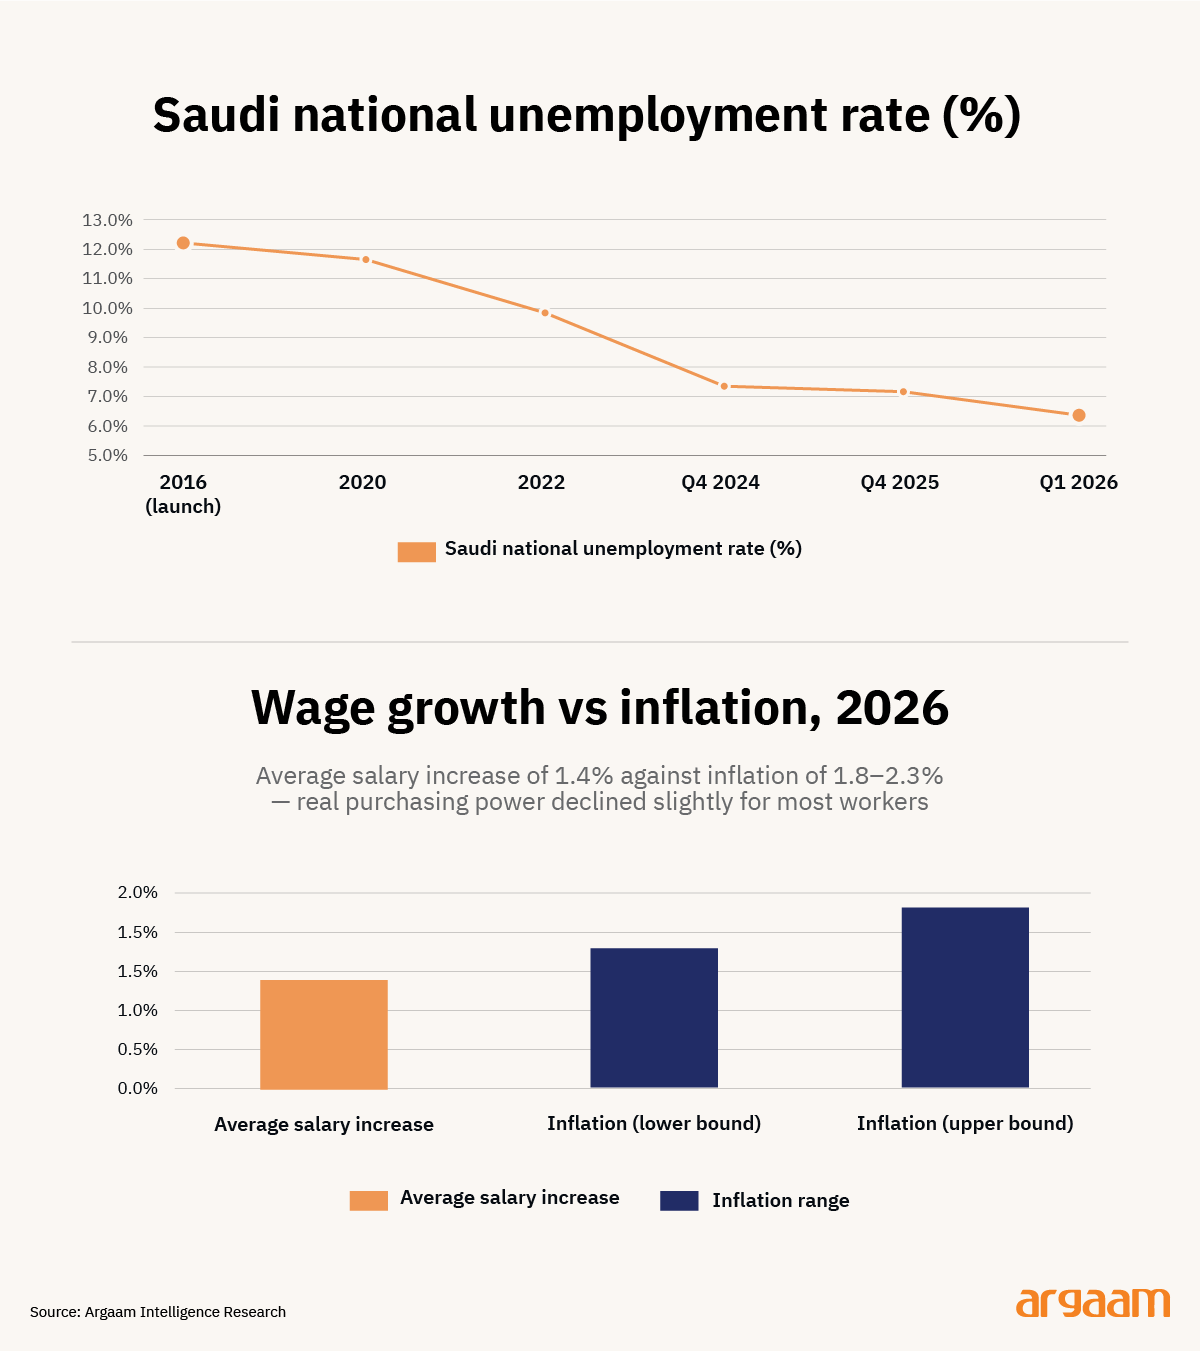
The unemployment rate among Saudi nationals fell to 6.4% in Q1 2026 — down from 12.3% when the economic transformation programme launched a decade ago.
Saudi Arabia's household consumption share stands at approximately 45% of GDP and has been rising — the opposite trajectory from China, where the same share has declined despite decades of impressive headline.
We argue that divergence is the first signal that Saudi Arabia's investment-led model is producing distributional outcomes that China's failed to deliver.
But the signal is not yet conclusive, and the expenditure breakdown reveals why. In Q1 2026, private final consumption rose 5.3% year-on-year while government final consumption expenditure rose 11.3%.
Government spending grew at more than twice the rate of household spending in the same quarter — a gap that raises a legitimate question about who is doing the heavy lifting.
It is worth noting that the surge in government expenditure in Q1 2026 reflects a deliberate counter-cyclical fiscal response to the geopolitical tensions, rather than a reversal of the underlying trend, though.
Through most of 2025, the government actually pulled back: government consumption fell 3.5%, and fixed investment declined 1.7%, yet private consumption still rose 3.6% year-on-year in Q4 2025.
That 2025 pattern — private demand holding up as the state stepped back — is the most encouraging data point in the main context of this analysis, because it suggests that domestic demand has some genuinely independent momentum.
The Test of Success: Wages, Not Surpluses
The consumption story is the analytical lens the China comparison made necessary. If the right test of economic success is whether growth is reaching households broadly enough to generate self-sustaining private demand, then the labour market and wage data are not a sidebar to the main story.
The movement of Saudi nationals onto private payrolls is real and substantial. Around 2.5 million have entered the private sector since 2020 (when the labour market strategy was launched), with the labour force participation rate among Saudis reaching 49.5% in Q4 2025, up 0.5 percentage points from Q4 2024.
Saudi Arabia's national unemployment rate declined to 6.4% in Q1 2026, while female unemployment reached a historic low of 9% — continuing a multi-year trajectory that has seen the Saudi unemployment rate roughly halve from 12.3% when the economic transformation programme launched a decade ago.
Examining the foundations on which the associated consumption growth rests, however, reveals a more nuanced picture that warrants closer analytical attention. Aggregate real wages have remained broadly flat, with increases concentrated among highly skilled roles.
This trend is driven by an influx of entry-level hiring that lowers the overall mathematical average, combined with strict corporate cost controls that limit broad pay increases to a highly selective group of talent.
The Gulf Business 2026 Compensation Outlook reports that across general operations, administration, and standard services, companies implemented an average salary increase of just 1.4%. When adjusted for the Kingdom’s 1.8% to 2.3% inflation rate, real purchasing power for the average worker actually decreased slightly.
The expansion in household spending has been driven primarily by a broader base of employed nationals rather than by significant gains in wages for those already in work.
Aggregate real wages have remained broadly stable, with meaningful increases concentrated among higher-skilled roles, according to the IMF's 2025 Article IV Consultation for Saudi Arabia.
This distinction carries implications for the durability of consumption growth: employment breadth creates a wider base of spending households, but wage depth is what sustains that spending as labour market conditions evolve.
Both dimensions matter, and the evidence on wages suggests that the second remains an area of ongoing development rather than a completed transition.
The structural scaffolding is also visible. Private hiring is shaped by Saudization quotas tied to a SAR 4,000 monthly wage floor and often underwritten by the Human Resources Development Fund, whose subsidies can cover up to half of a junior Saudi hire's first-year cost; the Fund placed 143,000 nationals into private jobs in Q1 2025 alone.
Consumer lending has risen around 10% annually, meaning some of the spending rests on credit rather than income. None of this invalidates the employment gains — but it means they are not yet fully self-sustaining.
The state is now beginning deliberately to step back. Total planned government expenditures are dropping from a revised SAR 1,336 billion down to exactly SAR 1,313 billion for 2026.
This 2% spending reduction reflects a deliberate optimization of capital allocations as massive phase-one infrastructure packages wrap up. The kingdom is also phasing out slowly and gradually domestic fuel subsidies to cut fiscal strain.
Financial filings and external audits confirm that the PIF recorded an $8 billion (SAR 30 billion) asset writedown on its major megaproject portfolio, and is tilting toward ventures capable of generating their own cash.
◆ Conclusion◆
China optimised for production and exports and ended up with one of the world's lowest household consumption shares — an economy that grew impressively while its citizens received a diminishing share of what it produced.
Taiwan accumulated a semiconductor windfall whose gains have not flowed proportionally to households. Both economies kept score by the wrong metrics, and both are now navigating the consequences.
Saudi Arabia stands out among regional peers with the strongest growth projections, with inflation at 2.3% by mid 2026. The World Bank (April 2026) projects Saudi Arabia's current account returning to a surplus of 3.3% of GDP in 2026, after a projected deficit of 2.7% of GDP in 2025.
But the right scorecard is not the surplus, not the non-oil share, and not any external ratio. It is what happens to private wages and private demand as the state steps back — and whether the employment gains of the past four years deepen into wage gains that can sustain consumption independently.