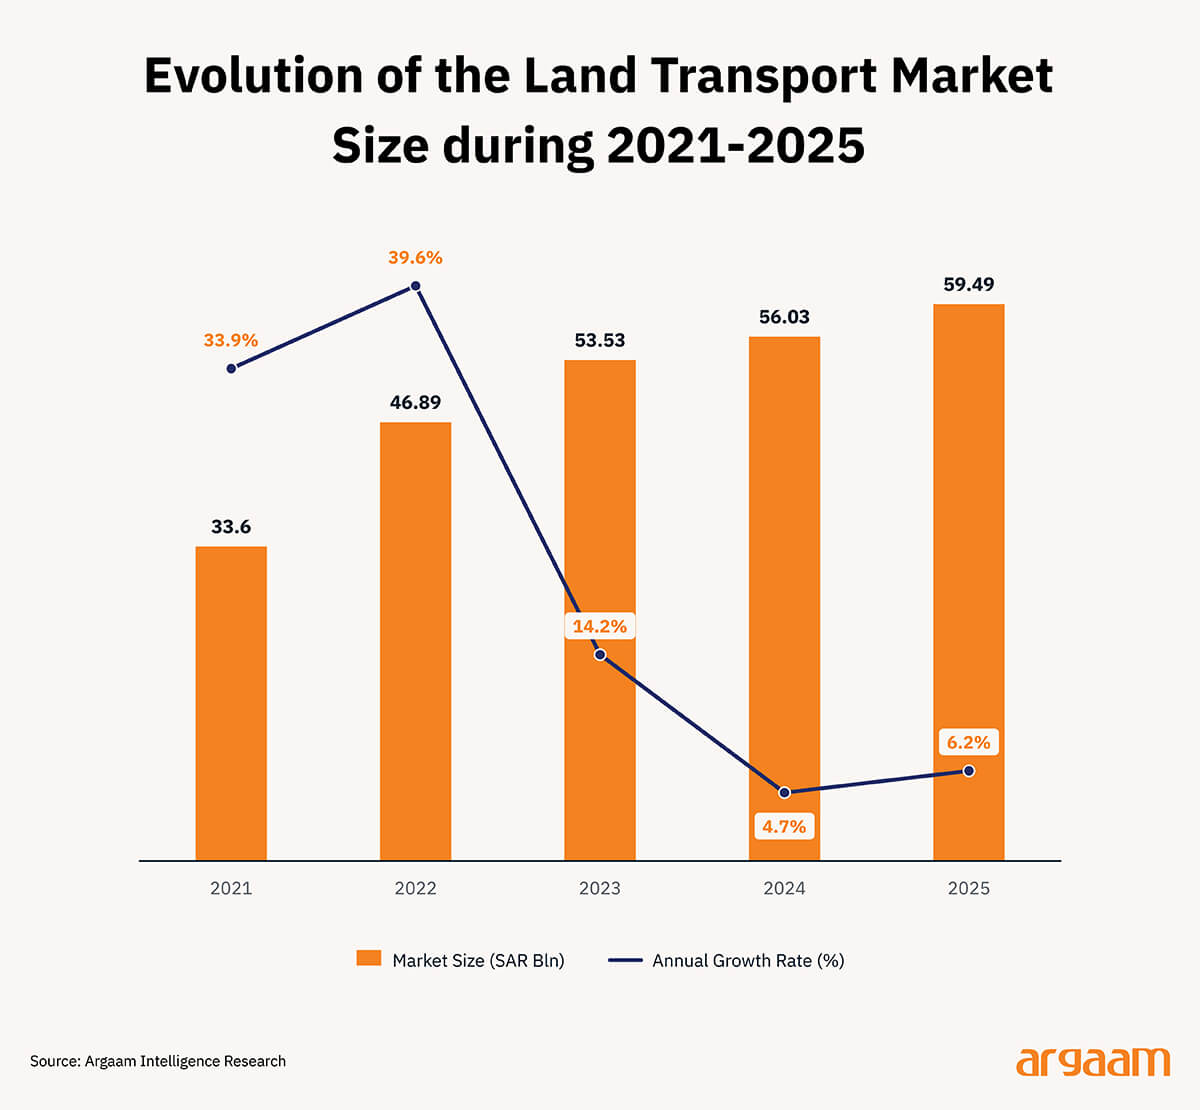
A recent Report by Argaam predicts that Saudi Arabia’s Land Transport Market will reach approximately SAR 93.7 billion by 2030, up from about SAR 59.5 billion in 2025.
These projections imply an increase of roughly SAR 34.2 billion to the market size over five years, representing an expected CAGR of 9.5%.
However, this growth alone does not answer the question that matters most to investors: Will the increase in market size translate into higher returns for all operating companies, or will changing demand patterns and competition position some business models to benefit more than others?
The answer is particularly important because land transport is not a homogeneous economic activity. It combines land and railway freight, mass transport, vehicle rental, ride-hailing applications, and delivery services.
These activities differ in capital intensity, cost structure, demand characteristics, and pricing power, making overall market growth a starting point for assessing investment opportunities rather than sufficient evidence of their attractiveness.
These activities differ in capital intensity, cost structure, demand characteristics, and pricing power, making overall market growth a starting point for understanding investment opportunities instead of sufficient evidence of their attractiveness.

A Larger Market and a Race for a Growth Share
Market growth was not the only development, as the expansion coincided with a notable rise in the number of establishments operating in land transport, from some 24,400 in 2021 to 51,300 in 2025.
This means that the increase in market size came in parallel with the entry of more establishments into the activity, which raises a question about how growth is distributed among operators and their ability to benefit from it.
An increase in the number of establishments does not necessarily make the Market less attractive. New entrants may reflect expanding demand and an improving investment environment.
Nevertheless, more operators also mean greater competition for incremental business, and market growth does not guarantee higher average revenue or a larger market share for each operator.
This relationship stands out when looking at the period from 2022 to 2025, as the estimated market size increased by approximately 27%, compared with nearly 61% growth in the number of establishments.
Although companies differ in size and activity, such a rapid expansion in the operator base underscores the importance of distinguishing between growth in economic activity and growth in the business each operator can retain.
Notably, growth in the number of establishments began to slow, reaching 5.5% in 2025, before recording a 1.5% decline in the first half of 2026 compared with the end of the previous year.
This may reflect changes in the pace of market entry and exit or other regulatory and operational factors. These figures alone are therefore insufficient to establish broad market saturation or declining profitability.
More importantly, competition differs across transport activities. In some markets, the primary challenge is meeting rising demand. Meanwhile, in others, the challenge is achieving sufficient operating scale to cover costs and maintain adequate margins.
Demand Growth May Reshape the Map of Beneficiaries
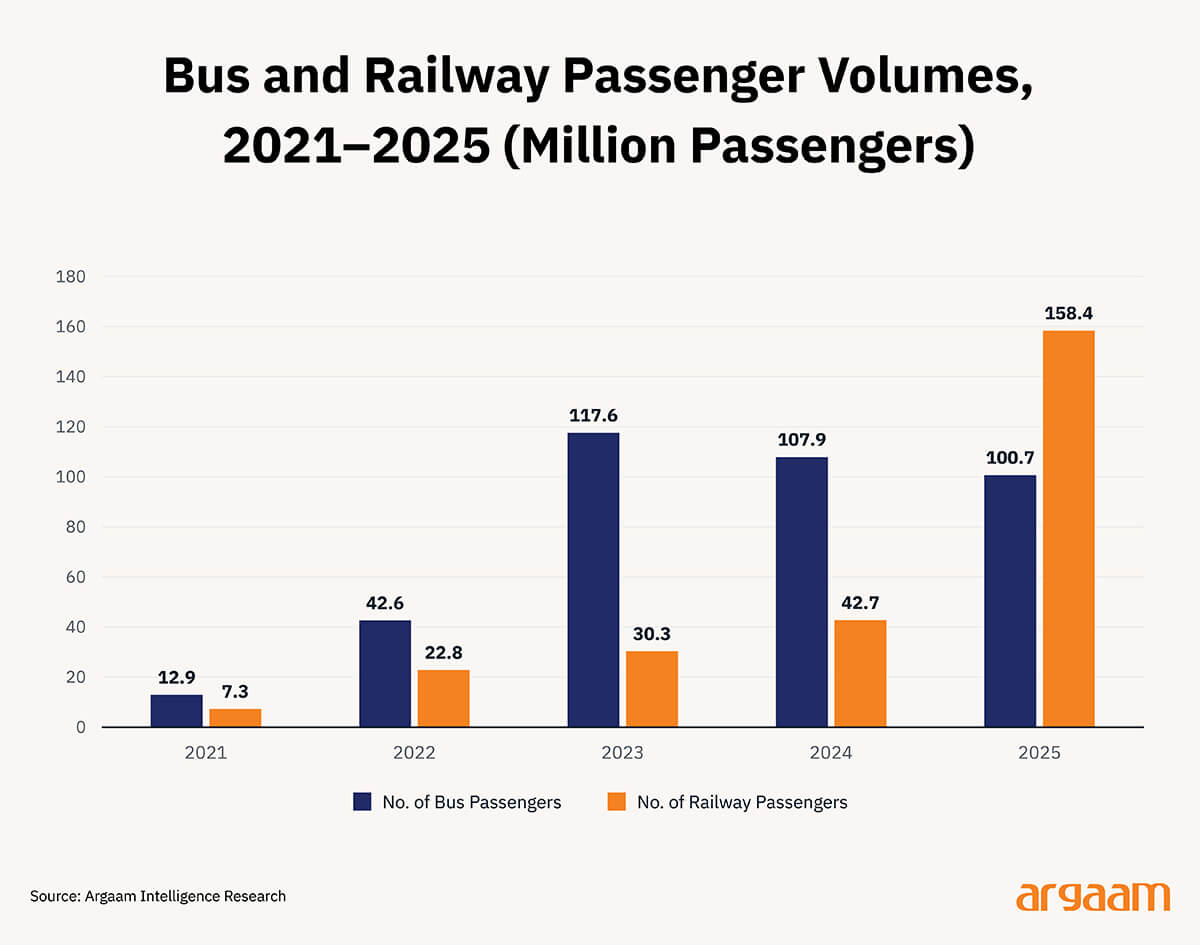
Passenger transport provides an example of how growth within a sector can reshape demand across different transport modes. Rail and metro passenger journeys in Saudi Arabia increased from 42.7 million in 2024 to 158.4 million in 2025, largely driven by the launch of Riyadh Metro services in late 2024 and their expansion in 2025.
Meanwhile, passenger journeys on urban and intercity buses declined from 107.9 million to 100.7 million over the same period.
It cannot be concluded from these two trends that the metro directly diverted passengers from buses, as network coverage and trip patterns differ. Some metro growth may reflect new trips or users switching from private vehicles and other transport means.
However, the data reveal an important shift in the passenger transport system, warranting a reassessment of the demand each operator serves.
From an economic perspective, metro expansion does not necessarily reduce opportunities for bus operators; it may create opportunities for station feeder services and connections between neighborhoods and major transport networks.
Buses offer greater flexibility in geographic coverage and route adjustments, while trains provide substantial capacity for frequent, regular trips.
Accordingly, passenger transport companies’ competitive edge may increasingly depend on their ability to integrate with new networks, rather than fleet size alone.
The investment case therefore centers on contract structures, vehicle utilization rates, operational efficiency, and the operator’s ability to capitalize on an integrated transport system.
A different competitive landscape is emerging in last-mile delivery, where completed orders rose from 228 million in 2023 to 412 million in 2025, an increase of more than 80% over two years.
However, the number of companies operating in the activity declined from 60 in 2024 to 51 by the end of 2025.
The Report indicates that the activity has experienced intense competition and several operators exist alongside a number of mergers and acquisitions, particularly as saturation has increased in major cities.
This illustrates how rising demand can coincide with changes in the competitive landscape rather than sustained growth in the number of competitors.
Companies that can fulfil more orders within a defined geographic area may benefit from higher driver and vehicle productivity and lower per-order costs. However, this advantage remains dependent on labor and delivery costs, commissions, and pricing, and may erode if attracting orders requires substantial marketing expenditure or discounts.
Passenger transport and last-mile delivery therefore illustrate a common point: Rising demand alone does not determine which companies benefit.
The outcome also depends on a business model’s ability to adapt to how demand is generated, distributed, and served cost-effectively.

When Does Revenue Growth Translate into Investment Returns?
This question becomes clearer when you consider the nature of land transport assets. Trucks, buses, vehicles, and equipment require capital investment and incur operating, maintenance, fuel, and labor costs.
Meanwhile, digital platforms require investment in technology, customer acquisition, and operations management.
Revenue growth can therefore produce different outcomes across companies. An operator that increases trips or shipments using existing assets may improve capacity utilization. Meanwhile, another operator may need to add vehicles, facilities, or operating capacity to accommodate the same growth.
In the first case, fixed costs per trip or shipment may decline if utilization increases without a corresponding rise in costs.
In the second case, however, business volumes may grow alongside increases in invested capital, financing costs, and depreciation, limiting the impact of growth on economic returns.
This is particularly important in freight transport, where an operator’s success depends not only on fleet size or shipment volumes but also on demand consistency, the share of loaded trips, empty miles traveled, and route planning efficiency.
Argaam assesses these operating indicators when conducting detailed company reviews in an advisory capacity at the individual operator level.
As for mass transport, returns may vary depending on operating contract terms, the extent to which the operator bears ridership risk as well as asset and operating costs. In last-mile delivery services, orders per driver or vehicle, cost per order, and customer acquisition and retention efficiency may be more meaningful than growth in total order volumes.
This highlights the distinction between revenue growth and shareholder value creation. A company experiencing rapid business growth does not necessarily create additional economic value if its return on invested capital does not cover its cost of capital. Companies therefore cannot be adequately assessed on revenue growth rates or market share alone without considering margins, cash flows, and returns on capital.
Where Could Value Emerge in the Coming Years?
The Report forecasts continued demand growth, supported by population growth, tourism and trade expansion, as well as investment in infrastructure, transport projects, and logistics services.
However, the impact of these drivers will vary depending on companies’ positions within the value chain. Companies operating integrated transport networks may benefit from rising demand for connectivity and distribution services.
Meanwhile, companies specializing in freight with specific requirements, such as refrigerated shipping or equipment transport, may differentiate through reliability and quality instead of competing solely on price.
These activities are not necessarily more profitable; however, profitability depends on demand, service costs, and competitive intensity within each segment.
Potential opportunities for value creation may also emerge for providers of fleet management, shipment tracking, and route planning technologies, provided their solutions demonstrate a tangible economic impact on operators’ costs and productivity.
In an expanding Market with rising efficiency requirements, companies that help other businesses achieve more productive growth may become increasingly important.
However, projections of future profitability should remain measured. Efficiency improvements may drive competitive price reductions, passing some benefits to customers rather than retaining them in company margins.
Higher financing, asset, or labor costs may also absorb some operating gains, even among operators achieving solid growth.
Identifying potential beneficiaries of Market growth therefore requires monitoring indicators beyond revenue. These indicators include fleet utilization rates, cost per trip or shipment, operating margins, free cash flows, and return on invested capital relative to its cost.
As Saudi Arabia’s Land Transport Market approaches its projected size of SAR 93.7 billion in 2030, the key question for investors will be not only whether growth meets expectations, but how that growth is distributed across activities and operators, and whether companies can scale their operations without disproportionate increases in costs and capital requirements.
A larger Market unlocks more business opportunities, but investment value ultimately depends on companies’ ability to translate such opportunities into sustainable returns, rather than simply participating in market growth.
For detailed estimates of market size and an analysis of demand drivers, competition, projects, opportunities, and challenges, refer to Argaam’s Report “Saudi Arabia’s Land Transport Market”:
|